Bespoke’s Global Macro Dashboard — 3/25/20
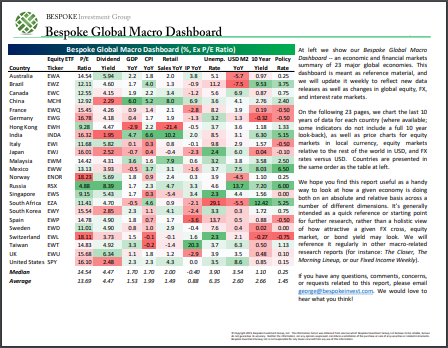
Bespoke’s Global Macro Dashboard is a high-level summary of 22 major economies from around the world. For each country, we provide charts of local equity market prices, relative performance versus global equities, price to earnings ratios, dividend yields, economic growth, unemployment, retail sales and industrial production growth, inflation, money supply, spot FX performance versus the dollar, policy rate, and ten year local government bond yield interest rates. The report is intended as a tool for both reference and idea generation. It’s clients’ first stop for basic background info on how a given economy is performing, and what issues are driving the narrative for that economy. The dashboard helps you get up to speed on and keep track of the basics for the most important economies around the world, informing starting points for further research and risk management. It’s published weekly every Wednesday at the Bespoke Institutional membership level.
You can access our Global Macro Dashboard by starting a 14-day free trial to Bespoke Institutional now!
Bespoke’s Morning Lineup – 3/25/20 – Volatility Still Reigns Supreme
See what’s driving market performance around the world in today’s Morning Lineup. Bespoke’s Morning Lineup is the best way to start your trading day. Read it now by starting a two-week free trial to Bespoke Premium. CLICK HERE to learn more and start your free trial.
Equity futures are indicating a modestly higher (or lower depending on when you look at the futures) open, but don’t let the numbers fool you. From midnight to around 4:30 eastern, S&P 500 futures rallied more than 4.5% in reaction to news of a deal being struck in DC over the $2 trillion coronavirus relief bill. From 4:30 through now, though, all of those gains have been erased.
Markets are still searching for equilibrium and trying to figure out when the economy will be able to re-open, and right now there is just about zero clarity on that front. Then, when the time comes where certain areas of the country look to be in the clear and can open for business a whole new set of questions will arise. First, how do you cordon off these areas that are no longer hotspots from the areas that are still hot?
Read today’s Bespoke Morning Lineup for a discussion of the details of the relief bill in DC, Asian and European markets, and the latest trends and statistics of the outbreak.

It’s been an exceptionally strong two days for gold as the yellow metal has rallied over 5% on back to back days. With all the liquidity being thrown into the system, some investors are clearly worried about the dollar’s purchasing power down the road. Going back to 1980, there have only been four prior periods where gold has seen similar moves on back to back days, with the last occurrence coming in September 2008. In other words, it has been extremely rare to see these kinds of moves.

The Closer – Epic Dash For Trash Drives Volatility Up – 3/24/20
Log-in here if you’re a member with access to the Closer.
Looking for deeper insight on markets? In tonight’s Closer sent to Bespoke Institutional clients, we review what factors drove today’s rally and where that leaves credit markets. We also show other ways that fixed income markets are returning to normal before reviewing today’s 2 year Treasury note auction. We close out tonight with a recap of our Five Fed Manufacturing Composite.

See today’s post-market Closer and everything else Bespoke publishes by starting a 14-day free trial to Bespoke Institutional today!
Warren Buffett Portfolio Check Up
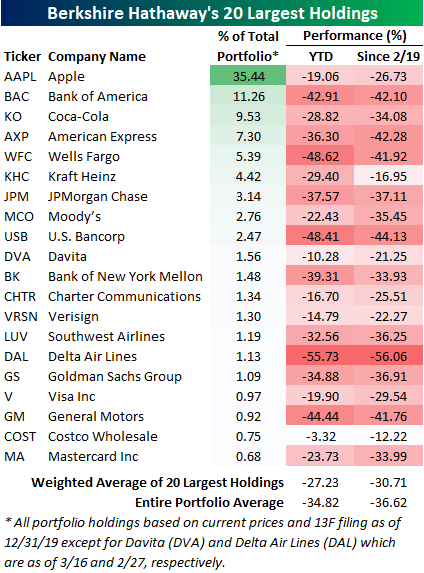
During tumultuous times, investors always turn to the sage advice of the Oracle of Omaha: Warren Buffett. With the S&P 500 down almost 30% from its record high back on February 19th, many are surprised from the silence out of Omaha. While Buffett is well known for weathering the worst market downturns and coming out stronger, the last several weeks have been just as painful on his portfolio as it has on the broader market. Fortunately for him, though, a mountain of cash has helped to cushion the blow of the decline.
Of Berkshire’s top holdings, the average stock is down 36.62% since the S&P 500’s last all-time closing high on 2/19 and down 34.82% YTD. The worst performing of the portfolio’s holdings has unsurprisingly been an energy sector name, Occidental Petroleum (OXY), which is down roughly 75% this year. On the other hand, Amazon (AMZN) has been a top performer in 2020 as it is currently up 3.5% YTD. But neither of these stocks are particularly large holdings. In the table below, we show the 20 largest holdings in the Berkshire portfolio as of the most recent 13F filing (in addition to positions in Davita (DVA) and Delta (DAL) which were added and disclosed more recently). Apple (AAPL) continues to be the crown jewel with a 35.44% weighting in the portfolio. At the S&P 500’s peak, Buffett’s position in AAPL was worth $79.3 bn, but the 26.7% decline since then has brought that value down to $58.13 bn. The next largest position and the only other one taking up a double-digit percentage in the portfolio’s total weight is Bank of America (BAC) which is down even more dramatically at 42%. Other notable weak holdings have been the airlines, Southwest (LUV) and Delta (DAL). For clients with access, we have also created a custom portfolio of Berkshire’s reported equity portfolio so you can track these names. Start a two-week free trial to Bespoke Institutional to access our Custom Portfolios, interactive tools, and full library of research.
Best Performing Russell 3,000 Stocks
The Russell 3,000 is currently down about 35% from its February 19th high. With such a substantial decline in the index in just over one month, it should come as no surprise that only a small handful of individual stocks are higher since the 2/19 peak. In fact, less than 2% of the index has risen in that time. The bulk of these stocks are Health Care names. As shown below, there are 28 Health Care stocks that have risen since 2/19 with two, Tocagen (TOCA) and Vir Biotechnology (VIR) having doubled in price in that time. Sixteen other stocks have seen double digit percentage gains in that time.

Of the stocks that are up in other sectors, many appear to be plays on a socially distanced coronavirus world. For example, in the Consumer Discretionary sector, the best performer has been food delivery and ordering app Waitr (WTRH) which has gone from $0.39 to $1.56. In that same vein, Domino’s Pizza (DPZ) has also performed well. Outside of the Health Care sector, the only sector with a large number of stocks that are up are Consumer Staples. As with many of these other stocks, these seem to be plays on the COVID-19 economy. Multiple grocers, wholesale stores, and food related names make the list alongside cleaning product company Clorox (CLX). Additionally, despite the rout of Energy names, there also are four Energy stocks that have distanced themselves from the pack and risen since 2/19 — TNK, SWN, DHT, EQT. Start a two-week free trial to Bespoke Institutional to access our full range of research and interactive tools.

Bespoke’s Morning Lineup – 3/24/20 – Limited Limits
See what’s driving market performance around the world in today’s Morning Lineup. Bespoke’s Morning Lineup is the best way to start your trading day. Read it now by starting a two-week free trial to Bespoke Premium. CLICK HERE to learn more and start your free trial.
Here we go again. Equity futures were trading on a limit up basis earlier but have since given up some of their gains. As things stand now, the US equity market is still poised to open up by about 4%, but where it goes from there is anyone’s guess. Optimism this morning stems from hopes that both sides of the political divide are closer to a stimulus deal in Washington and that some of the hardest-hit hotspots from the coronavirus are showing varying levels of improvement.
Light at the end of the tunnel in the coronavirus outbreak is obviously important because the sooner we see the light, the closer the US economy will be to moving out of its coma. This has been a contentious topic over the last 24 hours. On the one side, there’s a growing camp voicing concerns over the economic damage of the US and global shutdown. They are calling for at least a plan to be made for when, how, and under what conditions Americans will be allowed to go back to work. On the other side, a number of people argue that it’s still way too early to even start thinking about starting the economy back up as there are many more pressing concerns facing the country.
We’re not quite sure where the disagreement is here. In the words of NY Governor Cuomo, “you have to walk and chew gum in life.” In other words, can’t we address both the pressing Health Care needs facing the country and also start coming up with a plan for how Americans will be able to go back to work when the peak of the outbreak passes? Governments at all levels have come under enormous criticism for being caught flatfooted heading into this outbreak. Now that both Federal and state governments are thinking ahead, though, do they deserve the same criticism now? There are no easy answers in any of this, and no one is looking to get things back up and running if it is only going to make things worse, but that doesn’t mean we shouldn’t be asking the questions and coming up with plans and strategies as new data and treatments come to light.
Read today’s Bespoke Morning Lineup for a discussion of the latest figures in terms of Fed purchases in the last several days, the latest on the competing fiscal stimulus plans, and the latest coronavirus figures.
The Closer – Facilitating Liquidity – 3/23/20
Log-in here if you’re a member with access to the Closer.
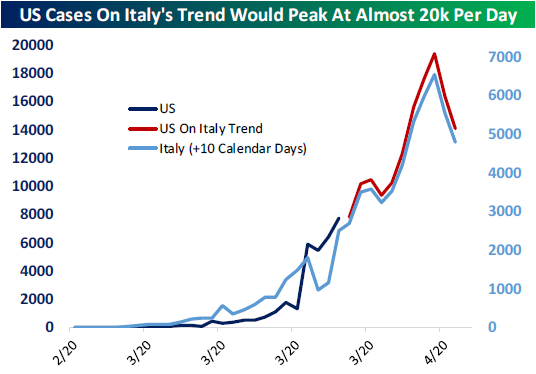
Looking for deeper insight on markets? In tonight’s Closer sent to Bespoke Institutional clients, we begin with a look at several assets which appear to have begun to stabilize. We then compare the COVID-19 situation in the US and Italy before taking an in depth look at the Fed’s actions that have taken place this past month. We close things out with a review of Eurodollar positioning.
See today’s post-market Closer and everything else Bespoke publishes by starting a 14-day free trial to Bespoke Institutional today!
A “Quiet” Day
The S&P 500 finished the day with a decline of nearly 3%, but if you ask a lot of people who pay close attention to the markets, it didn’t seem that bad. If you’re one of those people, you can thank the phenomenon of recency bias. That’s because even though the S&P 500 had a 2.93% move today, the average daily move in the four weeks heading into today was a gain or loss of 4.65%. In fact, over the last 20 trading days, there have only been five where the S&P 500’s average daily move was smaller.
The chart below shows the S&P 500’s average daily percentage move on a 20-day rolling basis going back to 1928. The S&P 500’s four-week average daily move is now greater than any other time since the weeks after the 1929 crash more than 90 years ago. Moves of this magnitude are nearly unprecedented in the history of the stock market, and the one precedent we have isn’t a very warm and fuzzy one. While we don’t want to minimize the significance of the equity market’s decline over the last month, the circumstances surrounding the two periods in terms of the reasons for the decline and the market dynamics during each period aren’t all that similar to each other. Start a two-week free trial to Bespoke Institutional for full access to our market analysis and much more.

Gold (GLD) Outshining Silver (SLV)
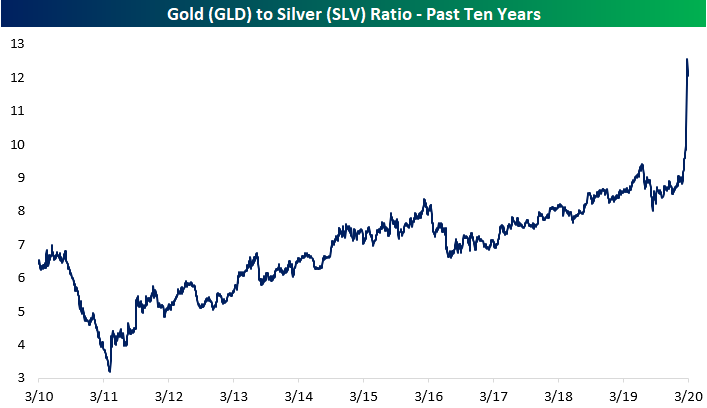
Not even precious metals have been safe from the wave of selling that has hit markets recently. While it could be expected that the massive declines in equities and big increases in liquidity would send gold or silver surging, that has not been the case. The Gold ETF (GLD) is actually down 3.61% since the S&P 500’s high on 2/19. Meanwhile, silver’s declines are perhaps more in line with risk assets like equities. The silver ETF (SLV) is down over 28% in that time frame. While there is that massive disparity between the two at the moment, for much of the past year SLV has been the weaker of the two metals. After both peaked in the late summer of last year, only GLD made it back up to fresh highs earlier this year. SLV, on the other hand, has cratered, reaching $12 one week ago. That is the lowest level since April of 2009.


With silver underperforming by such a wide degree, the GLD (gold) to SLV (silver) ratio has gone vertical (chart below) to levels never seen since the two ETFs have both been trading (2006). Again, gold’s outperformance is nothing new as this has been the case for most of the past decade. But the degree of gold’s recent outperformance has been much more dramatic. Start a two-week free trial to Bespoke Institutional to access our interactive economic indicators monitor and much more.
This Week’s Economic Indicators – 3/23/20
Economic data generally continues to remain of lesser importance than headlines due to the backward looking nature of the information, but recent indicators are beginning to reflect changes as a result of the coronavirus. Last Sunday night, the Fed kicked off the week with a return to ZIRP. Then on Monday, the New York Fed’s reading on the region’s manufacturing businesses posted its largest one month decline on record and its worst reading since the financial crisis. The Philadelphia Fed’s survey later in the week similarly deteriorated rapidly as it experienced its largest one month decline on record. These two surveys set a very negative tone for the other three regional Fed surveys scheduled to release this week and early next week. Last week’s retail sales were dramatically weaker than expected with every measure outside of the control group (which was flat in February) declining month-over-month. Homebuilder sentiment and other housing data like starts and existing sales also remained propped up thanks to lower interest rates, though, as rates have risen more recently that picture could subside a bit as was the case with last week’s mortgage applications. Finally, one of the most timely indicators, weekly jobless claims, spiked to 281K as an increased number of US workers remain quarantined at home.

While claims have generally been one of the most widely watched indicators of late, this week they are sure to take center stage as forecasts are calling for an increase of 1.4 million as more and more businesses halt operations. Though it is not likely to show coronavirus effects in the same way, elsewhere in labor data, we will get personal income and spending numbers this week. Following up on the NY and Philly Feds’ weak readings, the Richmond and Kansas City Feds will be releasing their respective manufacturing indices. Each one is expected to fall significantly to -10. Elsewhere in manufacturing data, Markit’s preliminary PMI is expected to fall into contraction territory alongside the services counterpart which had already fallen below 50 in February. Preliminary manufacturing hard data is also scheduled to release this week and is expected to decline MoM across headline and core measures. On the consumer front, University of Michigan sentiment is scheduled to round out the week with a decline to 89.5 from 95.9. Quarterly GDP data is also set to be released this week, but is one of the more lagged indicators and as such will only show the picture of a pre-coronavirus world. Start a two-week free trial to Bespoke Institutional to access our interactive economic indicators monitor and much more.
