Bespoke’s Morning Lineup – 4/12/21 – Low Energy Monday
See what’s driving market performance around the world in today’s Morning Lineup. Bespoke’s Morning Lineup is the best way to start your trading day. Read it now by starting a two-week free trial to Bespoke Premium. CLICK HERE to learn more and start your free trial.
“The person who starts simply with the idea of getting rich won’t succeed; you must have a larger ambition.” – John D. Rockefeller
The new week is starting off on a relatively quiet note, and futures are lower, but activity will pick up quickly as the week goes on. Besides earnings season, tomorrow we’ll get data on March CPI, and then Thursday’s data slate will include updates on Retail Sales, Jobless Claims, and both the Philly and NY Fed Manufacturing surveys. Then on Friday, we’ll close out the week with the March updates on Housing Starts and Building Permits.
Read today’s Morning Lineup for a recap of all the major market news and events including an overnight recap of market news and events, updates on Japanese Machinery Tool Orders, China Credit Creation, as well as the latest US and international COVID trends including our vaccination trackers, and much more.

After a big rally to close out the day on Friday, the S&P 500 finished the week well into overbought territory. Like the overall index, just about every sector is also in overbought territory except one – Energy. While every sector was up last week, Energy finished the week down over 4% and is just a bit over 1% above its 50-day moving average (DMA). Don’t feel too bad for the sector, though. Even after last week’s decline, the Energy sector ETF is still more than 28% higher from where it started out the year.

Bespoke Brunch Reads: 4/11/21
Welcome to Bespoke Brunch Reads — a linkfest of the favorite things we read over the past week. The links are mostly market related, but there are some other interesting subjects covered as well. We hope you enjoy the food for thought as a supplement to the research we provide you during the week.
While you’re here, join Bespoke Premium with a 30-day free trial!
The Fed
The Fed Is Making Wall Street Forecasters Pay Attention to Black Unemployment by Matthew Boesler (Bloomberg)
With the Federal Reserve altering its targets for the labor market to be more broad-based, forecasters are focusing on the most down-trodden parts of the labor market instead of headline data. [Link]
To catch a falling knife: US Treasuries and the Fed (Part 3) by Chris Marsh (Exante Data)
A dive into the mechanical relationships that underpin US Treasury markets, which will be forced to digest another robust year of issuance in 2021. [Link]
COVID
“We Are Hoarding”: Why the U.S. Still Can’t Donate COVID-19 Vaccines to Countries in Need by Katherine Eban (Vanity Fair)
With the various vaccine candidates delivering far more doses than looked possible during the period when their contracts were negotiated, the US is likely to have a large vaccine surplus this year, but not one that can be passed on to other countries. [Link]
Probable airborne transmission of SARS-CoV-2 in a poorly ventilated restaurant by Yuguo Liah, HuaQian, JianHang, Xuguang Chen, Pan Cheng, Hong Ling, Shengqi Wang, Peng Liang, Jiansen Li, Shenglan Xiaoa, Jianjian Wei, Li Liu., Benjamin J. Cowling, and MinKangd (ScienceDirect)
A detailed case study illustrating how important ventilation is for preventing outbreaks of COVID in relatively confined areas. [Link]
Investing
The Bubble Burst by Michael Batnick (The Irrelevant Investor)
A post-mortem on the rapid increase in value for the NBA’s blockchain-enabled video clip collectibles called “Top Shot”, which peaked at a market value of more than $2bn (greater than the median NBA franchise’s value) in February. [Link]
Individual Investors Retreat From Markets After Show-Stopping Start to 2021 by Caitlin McCabe (WSJ)
Online brokerage volumes, “meme” stock prices, and options activity are all sliding into reverse as the equity market craze that started the year starts to wear off from unsustainable levels of froth. [Link; paywall]
Venture
Patreon’s Valuation Triples to $4 Billion as Platform Draws Creators, Fans by Maria Armental (WSJ)
The latest fundraising round for subscription site Patreon values the company at $4bn, with growth tech hedge fund Tiger Global Management stepping in to the fray along with a range of other existing holders. [Link; paywall]
The new Normal: How one Midwestern town got swept up in the electric vehicle boom by Matt McFarland (CNN Business)
The electric vehicle boom is already having a huge impact on at least one small Midwestern town: Normal, IL is the site of battery-powered truck company Rivian (valued at $27.6bn), which has an edge over other EV truck contenders in the race to deliver emission-free pickups to the market. [Link]
Why the Air Force has its own venture capital fund by Mark Sullivan (Fast Company)
AFVentures will serve as a venture capital fund that can invest in and nurture potential defense technology investments on behalf of the Armed Forces’ airborne wing. [Link]
Roaring 20s
Sources: NBA aims for full arenas for 2021-22 season with increased testing, vaccines by Baxter Holmes (ESPN)
Widespread testing, vaccines, and biometric data are all keys to running NBA games at full capacity this year, with the league planning to put as many people in seats as will fit when games start in the fall. [Link]
Spring breakers face rental-car shortage by David Meyer (NYP)
With a return to normal summer holidays, the cost of renting cars has soared amidst a national shortage of vehicles, driving a 30% increase in prices nationally. Following bankruptcies and reductions in capacity, there just aren’t enough cars available. [Link]
Job Training
Job Training That’s Free Until You’re Hired Is a Blueprint for Biden by Steve Lohr (NYT)
A nonprofit offers a different model of job training: one where only students who actually find a job have to pay of the training, reducing the risk of upgrading skills. [Link; soft paywall]
Wardrobe
Why Are Furio’s Shirts So Good on The Sopranos? by Gabriella Paiella (GQ)
An investigation of the shirts worn by Neapolitan mafioso Furio Giunta, who made a habit of draping himself in flowing silk ensembles that made the rest of the show’s characters look downright wooden. [Link]
Sleep
Why You Stay Up So Late, Even When You Know You Shouldn’t by Ashley Lauretta (Wired)
“Sleep procrastination” is a coping method that relies on technology and anxiety to drive sufferers into late-night binges on phones or computers, keeping them awake far longer than they intended to be. [Link; soft paywall]
Read Bespoke’s most actionable market research by joining Bespoke Premium today! Get started here.
Have a great weekend!
Bespoke’s Morning Lineup – 4/9/21 – Quick Turnaround
See what’s driving market performance around the world in today’s Morning Lineup. Bespoke’s Morning Lineup is the best way to start your trading day. Read it now by starting a two-week free trial to Bespoke Premium. CLICK HERE to learn more and start your free trial.
“Slow and steady wins the race.” – Aesop
It’s looking like a modestly positive end to the week with S&P 500 futures slightly higher, but for all of the major indices, current levels are off their overnight highs after Chinese inflation data topped expectations. That has pushed the 10-year yield higher, and Nasdaq futures lower. Here in the US, PPI for the month of March was scheduled to be released at 8:30 Eastern, but as of yet, the data hasn’t been released.
Read today’s Morning Lineup for a recap of all the major market news and events including an overnight recap of market news and events, Chinese inflation data, weakening Industrial Production out of Europe, US and international COVID trends as well as our series of charts tracking vaccinations, and much more.
Slow and steady may win the race, but the turnaround we have seen in the Technology sector has been swift. Over the five trading days heading into today, Technology, which had been one of the weaker sectors on a YTD basis, has been the best performing sector in the S&P 500 by rallying 5.73%. The next best performing sector in the S&P 500 has been Communication Services, which is basically dominated by mega-cap tech-like stocks (GOOGL, FB, and NFLX). As a result of the move in Technology over the last five trading days, the sector has gone from just barely above its 50-DMA and closer to that level than any other sector to the most overbought sector in the S&P 500.
On the downside, the worst-performing sector in the S&P 500 is Energy, which has declined more than 1%, but even after that decline, the sector is still up more than 29% which is more than ten full percentage points than the next closest sector (Financials).

The Nasdaq 100 – Russell 2000 Roller Coaster Rolls On
Looking at the relationship between the largest of the large (Nasdaq 100) and the smallest of the small (Russell 2000) over the last 25 years, we can’t help but think of an old-time roller coaster with steep inclines and declines along the way. The runup of the Nasdaq 100 relative to the Russell 2000 in the late 1990s that peaked in March 2000 was nearly vertical, and the decline from that peak was just as steep. Once things bottomed out for the Nasdaq 100 in mid-2006, it embarked on a steady period of outperformance that started to accelerate in early 2016 and then really took off with the COVID outbreak in early 2020. Then in early September of last year, the Nasdaq 100’s relative strength peaked with the onset of the ‘big shift’. In the months following the Nasdaq 100’s relative peak in early September, the index saw its largest margin of underperformance relative to the Russell 2000 since the bursting of the Dot Com bubble.
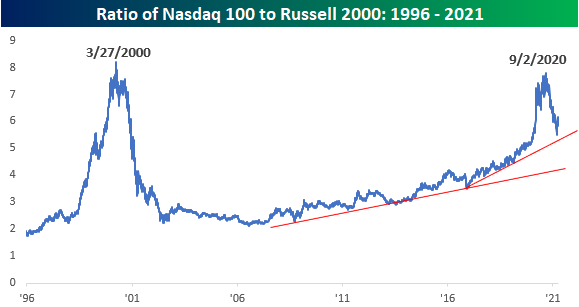
The chart below takes a more detailed look at the ratio between the two indices going back to just 2017. While the Nasdaq 100’s recent underperformance relative to the Russell 2000 has been sharp, it wasn’t nearly as steep as its vertical outperformance at the onset of COVID. In recent weeks, the Nasdaq 100 has seen a sharp rebound on both an absolute and relative basis. Since March 12th, the Nasdaq 100 is up over 5% while the Russell 2000 is down over 5%. What’s noteworthy about this bounce is that it occurred just above the uptrend line from the early 2016 lows and nearly at the exact same spot as the ratio was at the start of February 2020 when the pandemic was just getting ready to explode. Click here to view Bespoke’s premium membership options for our best research and market analysis available.

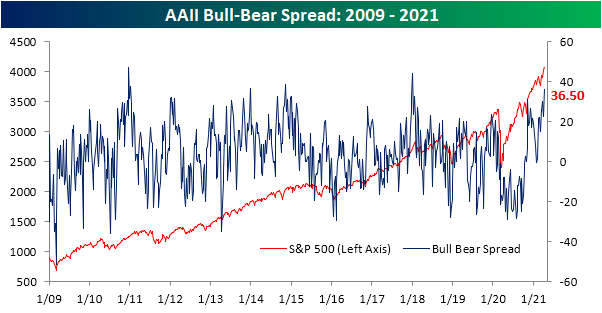
Sentiment Running Hot
With the major US indices pressing to new record highs, sentiment has picked up considerably in the past week. Bullish sentiment measured in the AAII weekly sentiment survey came in the top 5% of all prior weekly readings after rising by 11.1 percentage points to 56.9%. That makes for the largest one-week increase since the week of November 12th when bullish sentiment leaped 17.88 percentage points to 55.84%. This week also surpassed that November reading to make for the highest level of bullish sentiment since the first week of 2018 when 59.75% of respondents reported as bullish.

Bearish sentiment was already low headed into this week, but the reading fell another 2.8 percentage points to 20.4%. That is marginally lower than the reading of 20.6% from two weeks ago making for the lowest level of bearish sentiment since April 2019.

The big jump in bullish sentiment borrowed more heavily from the neutral camp. The percentage of respondents reporting as neutral collapsed 8.3 percentage points to 22.7%. Similar to bullish sentiment, that was the biggest single-week decline since November 12th and the lowest reading since that same week.

These moves mean sentiment now largely favors the bullish camp. In fact, the bull-bear spread rose to 36.5 which is the highest level since the first week of 2018.
To see what these types of sentiment readings mean for equity market returns, make sure to log in. If you aren’t currently a client, sign up for a free trial to one of Bespoke’s research offerings to view the rest of this report.
Which of the Bonds is Unlike the Others
When it comes to the fixed income space, 2021 has been a rough year. Just about every area of the sector you look at, YTD returns have been negative. Below is a snapshot of a custom portfolio of fixed income-related ETFs from our Trend Analyzer. Two things in the snapshot stand out. First, the only ETF in the group above its 50-DMA is the High Yield Bond ETF (HYG). Not only is it above its 50-DMA, but it’s also overbought! Given the recent strength in HYG, it is also the only ETF in the group that is up YTD with a gain of just under 1%. While short-term US Treasury related ETFs are down less than 1%, the TIPS ETF is down over 1% (TIP), total bond market ETFs are down over 3% (AGG and BND), the emerging market fixed income ETF is down close to 5%, while longer-term US Treasury ETFs are down over 10%!

Also noteworthy about the high yield bond market is the fact that the B of A High Yield Master Index just made a new all-time high on a total return basis, taking out its mid-February high. Apropos to its name, high yield has been a high point of the fixed income sector. Click here to view Bespoke’s premium membership options for our best research available.

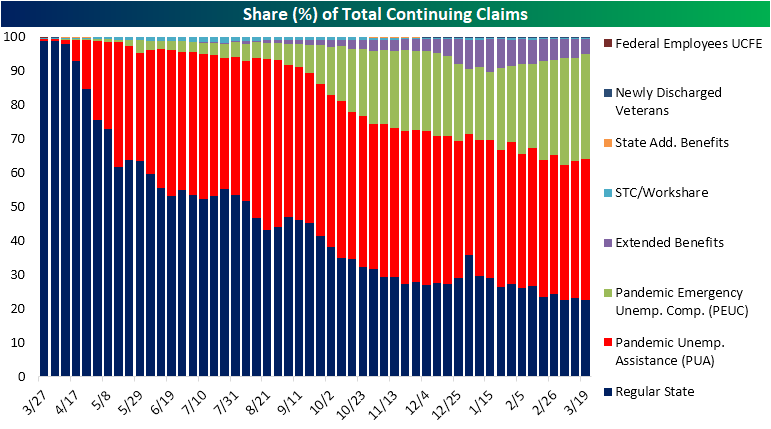
Mixed Claims Picture Based on Program
Initial jobless claims were expected to fall to 680K this week, which would have been just 22K above the pandemic low set two weeks ago. Instead, claims ticked higher for a second week in a row to 744K. Additionally, last week’s print of 719K was revised higher to 728K.
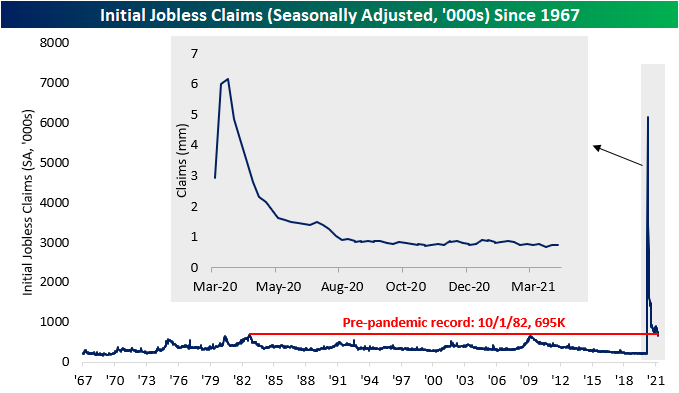
On a non-seasonally adjusted basis, the current week of the year (14th week) typically sees a higher reading in jobless claims. In fact, since 1967 when the data begins, the current week of the year has seen a week over week increase in initial claims 88.9% of the time. Of all weeks of the year, it is the third most consistent in experiencing higher claims. Given this seasonality, unadjusted claims rose 18.2K from last week. Although higher sequentially, that is still at the lower end of the past year’s range. Pandemic Unemployment Assistance (PUA) made up for that weakness, though. PUA claims fell by over 85K to a new pandemic low of 151.75K. That meant on a combined basis (regular state claims plus PUA claims), initial jobless claims were just slightly above the past year’s low from two weeks ago.

Continuing claims were also better this week falling to a new low of 3.734 million. While that marked the twelfth week in a row that claims have fallen and any new low is certainly welcome, we would note that the pace of improvement has decelerated. As shown below, continuing claims have been flattening out recently with this week’s 16K decline in seasonally adjusted continuing claims a prime example. That 16K improvement actually marked the smallest decline of the past year.
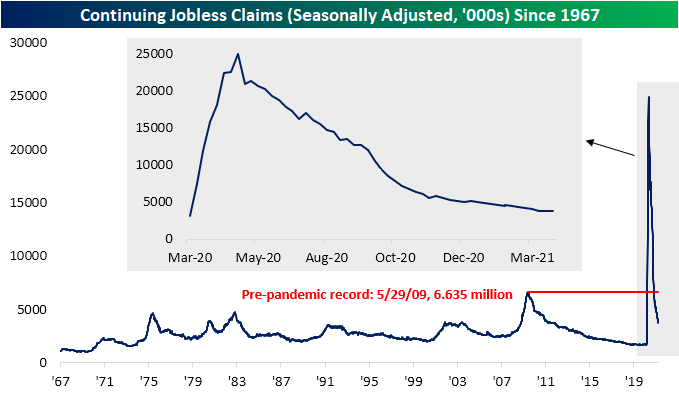
The most recent data factoring in all other unemployment programs is through the week of March 19th. Total claims were somewhat flat for that week with only a small decline from 18.249 million to 18.196 million. Big declines in regular state claims (-134.5K) and the Extended Benefits program (-230.78K) were largely offset by sizeable increases in PUA claims (+203.29K) and Pandemic Emergency Unemployment Compensation (+117.11K). In other words, the picture can be painted as improving or more of the same depending upon which program you are looking at.
In the past, we have noted the changing composition of continuing jobless claims with extension-based programs like Extended Benefits and PEUC taking up an increased share of total claims. For the most recent week, that picture is a bit mixed up. While the 230.78K decline for the Extended Benefits program meant these claims fell to the lowest since early December at 787K, PEUC claims (which is also a larger program with 5.6 million claims) were higher and in the middle of the past several weeks’ range. Together, these two extension programs’ share of total claims has peaked for the time being but still account for over 35% of total continuing claims. Click here to view Bespoke’s premium membership options for our best research available.

Bespoke’s Morning Lineup – 4/8/21 – Triumph of the Optimists
See what’s driving market performance around the world in today’s Morning Lineup. Bespoke’s Morning Lineup is the best way to start your trading day. Read it now by starting a two-week free trial to Bespoke Premium. CLICK HERE to learn more and start your free trial.
“I am so far from being a pessimist…on the contrary, in spite of my scars, I am tickled to death at life.” – Eugene O’Neill
If you’re looking at the futures for the S&P 500 and Dow, it’s looking like a flattish to modestly positive start to the trading day, but looking over at futures for the Nasdaq shows an entirely different story as that index is indicated to open up by nearly 1%. Driving the gains in the Nasdaq is the mega caps of Alphabet, Apple, Facebook, Microsoft, and Tesla which are all trading up by 0.75% or more in the pre-market. Given recent moves in the fixed income market, the recent strength of the mega-caps makes sense. Think about it, since the start of April we have seen some extremely strong to even historic levels of economic data points, but the yield on the 10-year US Treasury is actually down MTD. Strong data and lower rates? The mega-caps will take it!
Read today’s Morning Lineup for a recap of all the major market news and events including Japanese purchases of treasuries, German factory orders, US and international COVID trends as well as our series of charts tracking vaccinations, and much more.
Another area of the market where we’re seeing some unwelcome strength is in sentiment. This morning’s release of bullish sentiment from the American Association of Individual Investors (AAII) showed that bullish sentiment surged by the most since November to 56.90%. The last time this reading was higher was way back in early 2018.

Triple Plays Chart Update
The earnings calendar has been quiet, and it will remain that way until the second half of the month when the Q1 earnings season really kicks into gear. When it comes to earnings, the 3 month rolling EPS beat rate and guidance spread have pulled back significantly over the past few months. Granted, both of these as well as the sales beat rate remain at levels well above typical levels. As such, there have been a huge number of triple plays over the past three months, 268 of the total 2048 reporting companies to be exact. A triple play is when a company reports better than expected sales and earnings while also raising guidance. Typically, this can be viewed as a sign of fundamental strength for a company.
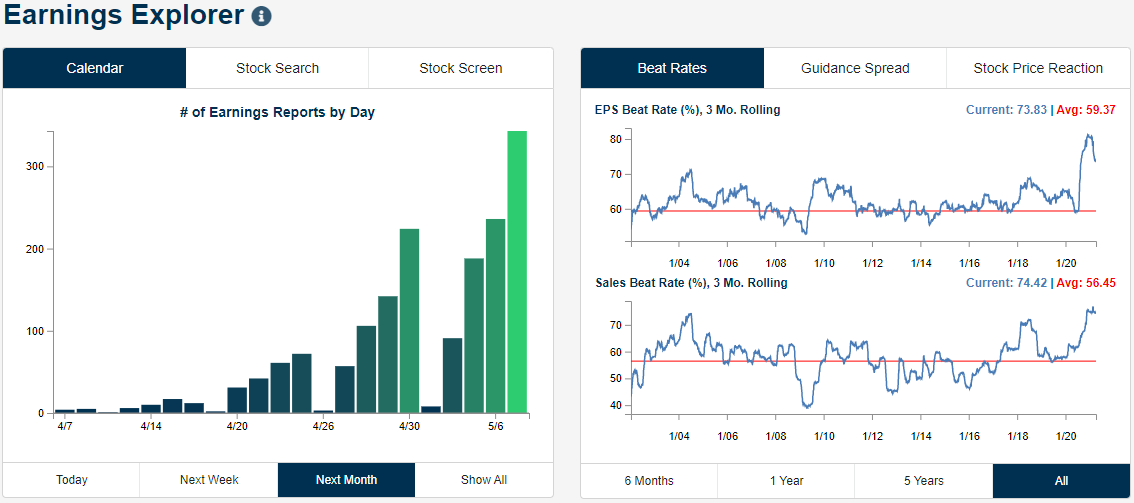
Looking over those triple plays, the average stock that has reported a triple play over the past three months rose over 3% on its earnings reaction day with 64% finishing the day in the green. That positive performance has tended to continue in the weeks after earnings although there have been some that have recently been consolidating. In the charts below, we show a handful of these. Some like Abbott Labs (ABT) and Perficient (PRFT) have been in short-term downtrends that have brought them back down to support around their 50-DMAs. Others like Analog Devices (ADI), Broadcom (AVGO), and Crocs (CROX) have been stuck under resistance over the past several weeks but have made attempts to break out in the past few days. For all of these, there has yet to be a decided move either to the up or downside.

While the names above have yet to break out of their consolidation ranges, there are a number of recent triple-plays that have successfully managed to break out to the upside. For a recap of those names, make sure to log in. If you aren’t currently a client, sign up for a free trial to one of Bespoke’s research offerings.
As Close to a Perfect Year For Equities as You Can Get
Every day in our Morning Lineup, we provide a technical snapshot of the market looking at various metrics. One chart we show is the relative strength of stocks (S&P 500) versus bonds (US Treasury Long Bond Future) over the trailing 12 months (chart below). Whenever the line is in the green area, it indicates that stocks are outperforming bonds relative to the start date, while readings in the red zone indicate bonds outperforming stocks. What stood out about the chart in this morning’s report was the fact that relative to one year ago (4/1 close), stocks have been outperforming bonds every day since. Sure, there have been periods in between where bonds outperformed stocks (falling line), but from a longer-term perspective, it has been about as perfect a year for stocks relative to bonds as you could imagine.
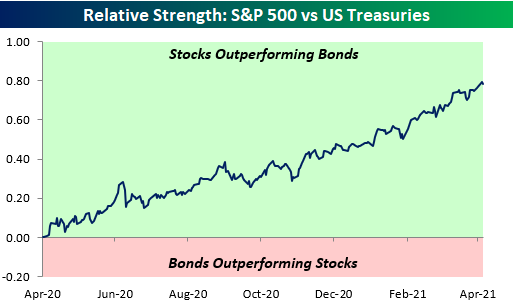
The chart below shows the performance of both asset classes individually over the last year. If you think the divide between political parties in the US has ripped wider, it has nothing on the growing divide between stocks and bonds. While the S&P 500 is up over 50%, the US Treasury Long Bond Future is down 14%. If we had to bet on which divide will start to narrow sooner, is there anything closer to a sure thing than taking the stock vs bond divide over the Democrat vs Republican divide? Click here to view Bespoke’s premium membership options for our best research available.
