Cryptos Reach Historic Oversold Streak
Cryptos have started off the new week with more declines as Bitcoin is down over 2.5% today and Ethereum has fallen nearly a full percentage point more. For both, those moves drive them deeper into oversold territory, which as we discussed in last Friday’s Crypto Report, is already an extended streak of oversold readings. For Bitcoin, today marks the 17th straight day trading at least one standard deviation below its 50-DMA. While it stands out from all oversold streaks going back to 2014, it is not the longest streak on record or even in recent months. In fact, before a brief stint within neutral territory, Bitcoin traded over one standard deviation below its 50-day for 25 straight days ending May 29th of this year and that followed another 32 day long streak that ended in February.
Although its history is not as long as Bitcoin, Ethereum has been trading in oversold territory for an even more impressive length of time. Today is the 54th oversold day which has far surpassed the previous record of 38 days. To add injury to insult, the prior record streak occurred earlier this year as Ethereum is now trading at a third of the price it was trading at to start the year. Click here to learn more about Bespoke’s premium stock market research service.

The Bespoke Emerging Market 50 – 6/27/22
The Bespoke Emerging Market 50 tracks emerging market equities that have either strong earnings growth, the potential to recover substantially in the foreseeable future, or unique upside based on the current geopolitical environment. As the name implies, all of these companies are domiciled in emerging market economies (with ADRs). In this report, we highlight risks and opportunities in emerging markets before diving into the differences between our basket and the iShares MSCI Emerging Markets ETF (EEM). The back half of the report involves a brief summary of each of the 50 stocks in the basket, including fundamental insights, growth opportunities, and risks. The Bespoke Emerging Market 50 is updated on a quarterly basis.

The Bespoke Emerging Market 50 is available at the Bespoke Premium level and higher. You can sign up for Bespoke Premium now and receive a 14-day trial to read our Emerging Market 50 report. To sign up, choose either the monthly or annual checkout link below:
Bespoke’s Morning Lineup – 6/27/22 – Two Minute Warning
See what’s driving market performance around the world in today’s Morning Lineup. Bespoke’s Morning Lineup is the best way to start your trading day. Read it now by starting a two-week trial to Bespoke Premium. CLICK HERE to learn more and start your trial.
“In times of rapid change, experience could be your worst enemy.” – J. Paul Getty

Below is a snippet of content from today’s Morning Lineup for Bespoke Premium members. Start a two-week trial to Bespoke Premium now to access the full report.
Bulls finally caught a break last week with the S&P 500 up well over 5%, and they’ll be looking to finish up the quarter on a positive note as we head into the end of the first half. The bears are still comfortably in the lead heading into the half, but a late ‘field goal’ or even ‘touchdown’ for the bulls in the final days would make things look a little more respectable to kick off the second half. Futures are higher this morning but have been drifting as the opening bell approaches and treasury yields rise as the 10-year trades back near 3.2%. Investors continue to be tossed around by moves in the treasury market as market rallies tend to push yields higher and eventually to levels that cause angst on the part of equity investors.
Durable Goods orders were just released and came in higher than expected, while later on, we’ll get updates to Pending Home Sales (10:00 AM Eastern) and the Dallas Fed report for June (10.:30). On the earnings front, we’ll hear from Jefferies (JEF) and Nike (NKE) after the close.
In today’s Morning Lineup, we discuss the news coming out of the G7 meetings, overnight moves in Asian and European markets, US rig counts, and overnight economic data from Asia and Europe.
With gains of over 6%, last week was a very good one for US equities. Good, that is for every sector except Energy. Sectors leading the rally included Consumer Discretionary, Health Care, and Real Estate, but Technology and Utilities also outperformed. Despite the big gains last week, all five sectors are still in the red YTD, and only Health Care is above its 50-day moving average (DMA). Ironically enough, Energy was the only sector down on the week and is the furthest below its 50-DMA, but it is also the only sector up YTD and with a gain of over 30% it’s leaving the other ten sectors in its dust.

Speaking of the Energy sector, while it has easily been the best performing sector over the last year, the last week of the month has been routinely weak for the Energy sector. As shown in the chart below, over the last year, the sector has underperformed the S&P 500 in the last week of the month ten out of twelve times with a median margin of 2.5 percentage points in underperformance. Energy has been a high octane sector lately, but it hasn’t had much in the way of endurance on a month-to-month basis.

Start a two-week trial to Bespoke Premium to read today’s full Morning Lineup.
Bespoke Brunch Reads: 6/26/22
Welcome to Bespoke Brunch Reads — a linkfest of the favorite things we read over the past week. The links are mostly market related, but there are some other interesting subjects covered as well. We hope you enjoy the food for thought as a supplement to the research we provide you during the week.
While you’re here, join Bespoke Premium with a 30-day free trial!
Cancer & Carcinogens
A turning point in cancer by Eric Topol (Substack)
Scientists have released an unprecedented series of breakthroughs related to cancer treatment, covering a wide range of therapies and types of cancer which could have huge impacts on overall mortality and quality of life. [Link]
FDA to Order Juul E-Cigarettes Off U.S. Market by Jennifer Maloney (WSJ)
E-cigarette leader Juul has been ordered off the US market after a two year review of data as part of an authorization process. Juul limited marketing and its flavor range in 2019, but its history of targeting teens will reportedly keep it off the market. [Link; paywall]
Supply Side
How Much Do Supply and Demand Drive Inflation? by Adam Hale Shapiro (FRBSF Economic Letters)
An analysis of PCE inflation suggesting that supply-side factors have been responsible for about 80% more inflation than demand-side factors (though those have also added substantially to overall PCE inflation. [Link]
The Supply-Side Damage Has Begun: The Dark Side Of Fed Tightening by Skanda Amarnath (Employ America)
The Fed’s tightening campaign has led to significant damage in housing markets already, and that damage is likely to lead to long-term damage to the supply side, making housing more expensive long-term. [Link]
Real Estate
Empty Wall Street Offices to Be Revived as Apartments by Rebecca Picciotto (WSJ)
A giant office tower at 55 Broad St is being renovated and converted into apartments as strong demand for rental units meets a slowdown in demand for central business district office. [Link; paywall]
Sky-High Housing Prices Look Back Down to Earth by Charlie Wells (Bloomberg)
After a staggering surge in home prices around the world, higher rates and eye-watering valuations are coming back to bite recent buyers. [Link; soft paywall]
Investing
JPMorgan Says Retail Investors Are Finally Bailing on Stocks by Lu Wang (Yahoo/Bloomberg)
After sticking with stocks all the way down, smaller investors may be starting to capitulate…just in time for stocks to rally, if the contrarian history of retail investors is any indication. [Link]
Facebook, Netflix and PayPal Are Value Stocks Now by Gunjan Banerji (WSJ)
Former high-flying tech names Meta (FB), Netflix (NFLX), and PayPal (PYPL) are all headed from growth to value per FTSE Russell methodologies which are updating the lists of stocks by style. [Link; paywall]
Ecology
World’s biggest bacteria discovered in Caribbean mangrove swamp by Clive Cookson (FT)
An absolutely enormous bacteria 50x as large as the previous record has been discovered in a mangrove swamp in Guadalupe; unlike virtually all other bacteria species, these are literally visible to the naked eye. [Link; paywall]
New Kings
Khabane Lame unseats Charli D’Amelio as top TikTok star with 142.8M fans by Andrew Court (NYP)
A former machine operator whose videos parody excesses of other creators has become the most-followed creator on TikTok. [Link; auto-playing video]
This Teen Has Already Broken Some of Usain Bolt’s Records. He’s Getting Faster. by Jeré Longman (NYT)
An 18-year old has become the fourth-fastest 200-meter runner in world history, and is a serious contender for the US championships this year. [Link; soft paywall]
Read Bespoke’s most actionable market research by joining Bespoke Premium today! Get started here.
Have a great weekend!
The Bespoke Report – 6/24/22 – The Frantic Fed
This week’s Bespoke Report newsletter is now available for members.
Equity markets turned in a more positive week as interest rates traders mulled the possibility of lower commodity prices bailing out a Fed that looks intent on committing a policy error. We discuss the Fed’s missteps, the widespread declines in a number of major commodity markets, the relationship between recessions and bear markets, the messages being sent by interest rates, why oil supply problems aren’t fixed even if prices have dropped, the implications of large declines like the last few weeks for forward returns, global equity market performance and trends, bad overseas economic data this week, slowing manufacturing surveys in the US and around the world, housing affordability, interest rate sensitive sectors of the stock market, and more in this week’s Bespoke Report.
To read this week’s full Bespoke Report newsletter and access everything else Bespoke’s research platform has to offer, start a two-week trial to one of our three membership levels.


History Repeating Itself?
With just a few days left in the quarter, equities are catching a bid, and through mid-day Friday, the S&P 500 is up just about 6% from its recent low last Thursday (6/16). The bounce has a lot of investors asking whether last week’s leg lower marked a capitulation point from which the market can stage a meaningful rally. A lot of investors and 401(k) accounts would most certainly welcome that type of move, but if you’re starting to feel a bit like Bill Murray’s character Phil Connors in the movie Groundhog Day, there’s a reason.
The chart below shows the QTD performance of the S&P 500 in Q1 versus Q2 of this year. In both quarters, the market started out with fleeting gains that quickly turned into steep losses with little relief throughout the quarter. The only relief in Q1 came in the second half of March when the S&P 500 rallied 11% off its lows in eleven trading days. This time around, the late quarter rally took longer to materialize, but in the five trading days since last Thursday’s (6/16) close, the S&P 500 has rallied 6% with another four trading days left to go. In order for investors to have the confidence that this current rally has more behind it, they’re going to want to see more than just a late quarter rally but also some follow-through into Q3. Click here to learn more about Bespoke’s premium stock market research service.

Bespoke’s Morning Lineup – 6/24/22 – Two For Twelve
See what’s driving market performance around the world in today’s Morning Lineup. Bespoke’s Morning Lineup is the best way to start your trading day. Read it now by starting a two-week trial to Bespoke Premium. CLICK HERE to learn more and start your trial.
“The riskiest strategy is to try to avoid risk altogether.” – Fredrick W. Smith
Below is a snippet of content from today’s Morning Lineup for Bespoke Premium members. Start a two-week trial to Bespoke Premium now to access the full report.
This week marks the 12th and final full week of the second quarter and barring a calamitous reversal from pre-market levels, it will be just the second positive full week of trading during Q2. That’s how bad of a quarter Q2 has been. Gains this quarter have been awfully hard to come by.
Futures are looking to finish off what has already been a positive week on an up note, but in order to stay there, we’ll have to get through the Michigan Confidence and New Home Sales reports at 10 AM. The Michigan Confidence report will be an update to the preliminary reading that was released two weeks ago and came in at the lowest level in the history of the survey dating back to 1978. It’s hard to imagine that report getting any worse.
In today’s Morning Lineup, there’s a lot covered as we discuss overnight moves in Asian and European markets, declining volatility in the crypto space, and overnight economic data from Asia and Europe.
It’s been a rough few weeks for copper as yesterday’s 5%+ decline capped off its worst five and ten-day declines since March 2020 at the depths of the COVID crash. With the title of doctor, copper’s performance is often considered to be a good gauge of the economy’s health, so the recent declines naturally raise economic concerns.
The chart below shows the historical 10-day rate of change in copper going back to 1981. During that span, there have only been seven other periods where copper declined 20% or more in a ten-day span, and as mentioned above, the most recent was during the original COVID lockdowns. There were also similar or larger declines during the Financial Crisis recession and the recessions of the early 1980s (not quite 20%) and early 1990s. While large short-term declines in copper did occur during four of the last five recessions, there were also a number of other large declines that occurred outside of recessions (1986, 1987, 2011, and 2018). Large short-term declines in the price of copper have often occurred during recessions, but they aren’t exclusive to recessions.

Start a two-week trial to Bespoke Premium to read today’s full Morning Lineup.
Chinese Stocks Have Been Outperforming
On a year to date basis, both the S&P 500 (SPY) and the KraneShares China Internet ETF (KWEB) are well in the red. However, KWEB is now outperforming SPY (-11.9% vs. -20.8%) by a considerable margin after bouncing 50% off its lows in early March. Since late May (5/24), KWEB has gained 29.7% versus a decline of 4.5% for SPY. As you can see in the first chart below, KWEB has made a few higher lows over the last few months, while SPY has continued to make lower lows.


The rolling three-month performance spread between KWEB and SPY hit an all time high of +55.8 ppts on June 10th of this year. Although the performance spread has fallen over the last few trading sessions, the outperformance is still quite notable. (It’s also worth noting that KWEB is still much further below all time highs than SPY with KWEB down 69% and SPY down 21%.)
In March of 2021, KWEB topped out and shed a considerable amount of its value. SPY didn’t follow suit until about nine months later. With KWEB rallying off of lows in recent months and actually attempting to start making higher highs, equity market bulls are hoping KWEB is leading to the upside similar to how it led to the downside.

While US markets have struggled over the last three months, Chinese equities have held up well. In this time period, the S&P 500 (SPY) has declined 16.5%, but the KraneShares China Internet ETF (KWEB) has gained 5.6%, resulting in a performance spread of 22.1 percentage points. The rolling three month performance spread peaked at 55.8 ppts on June 10th, as KWEB had gained 49.8% and SPY had dropped by 6.5% over the prior three months. This was the largest 3-month performance spread since KWEB began trading in September 2013. Throughout KWEB’s history, there have only been ten occurrences of KWEB outperforming SPY by more than 20 percentage points over three months (for the first time in three months). Although Chinese equities are still well off their highs, this recent outperformance definitely raises some eyebrows. Click here to learn more about Bespoke’s premium stock market research service.
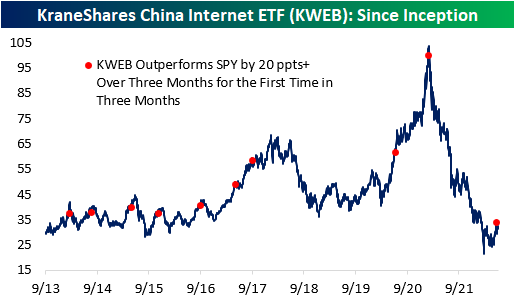
Historically, when KWEB has outperformed SPY by 20 ppts or more over three months (for the first time in three months), the ETF has tended to deliver weak forward performance. Of the nine prior occurrences, only two resulted in positive performance over the next three months, and the average return was -7.4% (median: -7.8%). Over the next year, KWEB has tended to underperform its historical averages by 12 percentage points. Across the board, positivity rates are lower than that of all periods, which holds true for median and average performance as well. Click here to learn more about Bespoke’s premium stock market research service.

Jobless Claims Move Lower
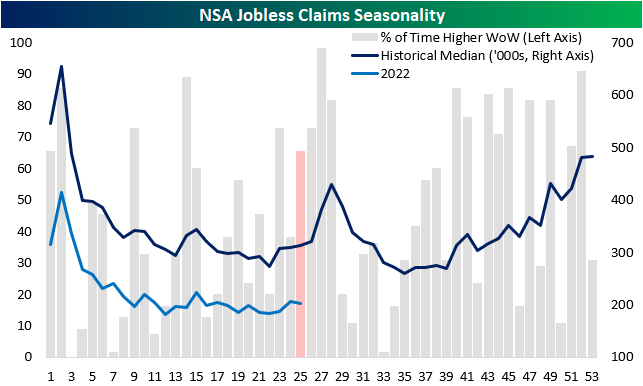
Jobless claims have been trending higher off of multi-decade lows, indicating a moderating labor market. This week, initial claims would have gone unchanged week over week at 229K if it were not for a modest upward revision to 231K to last week’s number. Claims did not change much on a week-over-week basis and remain modestly above the levels that were in place in the months before the pandemic. While it has been more than three months since initial jobless claims made a post-pandemic low, the rate of increase of those lows has been somewhat modest. Click here to learn more about Bespoke’s premium stock market research service.

On a non-seasonally adjusted basis, claims moved moderately lower after topping 200K for the first time since late April last week, and at a level of 203K, this week’s figure is the lowest in the last twenty years relative to comparable weeks.

Continuing claims lag by one week relative to initial claims and moved higher for the third consecutive week, representing the longest streak of weekly increases since March 2020. However, the magnitude of the rise was quite small. In fact, at the current level of 1.315 million continuing claims are still 2.1% below the level they were at a month ago. Click here to learn more about Bespoke’s premium stock market research service.

Sentiment Worsens… Again
Even as the ten-year yield and crude oil have pulled back over the last few trading sessions and the S&P 500 has recuperated the losses from late last week, the percentage of respondents to the AAII survey considering themselves bullish fell for the third consecutive week. This week’s reading of 18.2% marks the lowest level since late April and ranks in the bottom 1.3% of all weeks going back to the start of the survey in 1987. On the bright side, the rate of decline in bullish sentiment has been on the decline as the percentage of respondents that considered themselves bullish fell by 11 percentage points two weeks ago, 1.6 percentage points last week, and now just 1.2 percentage points this week.

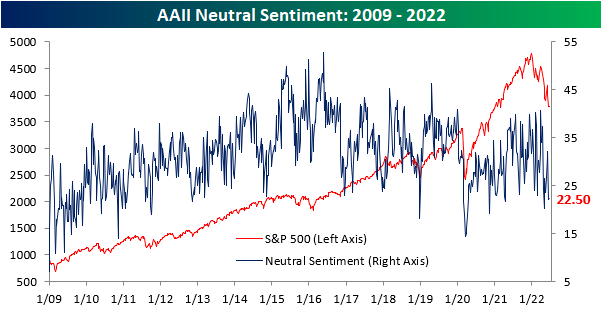
The percentage of respondents reporting neutral sentiment moved modestly higher, increasing by just 30 basis points to 22.5%. Click here to learn more about Bespoke’s premium stock market research service.
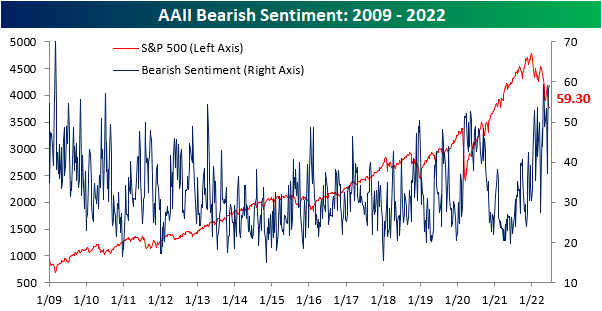
The percentage of respondents reporting bearish sentiment rose for the third consecutive week to 59.3%, the highest level since late April. The 4/28 reading was only 10 basis points higher than this week’s, so we are near the previous peak in terms of bearish sentiment. Apart from the late April reading, bearish sentiment had not topped 59% since early March of 2009. In fact, this week’s reading is in the 97th percentile of all readings since the survey began in 1987.
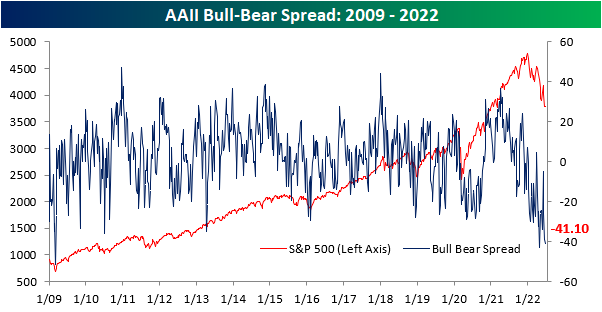
The bull-bear spread remains near historic lows, and there have now been 22 consecutive weeks in which the spread was below -10 (smoothed out by taking a four week moving average). We are now just four weeks away from setting a new record in this regard. The previous high was in 1991 when there were 26 consecutive weeks in which the bull-bear spread was under -10. Investors often view this as a contrarian indicator, as low readings in bullish sentiment leave upside for the market should sentiment bottom out and positive news emerge. Click here to learn more about Bespoke’s premium stock market research service.