Bespoke’s Morning Lineup — 10/27/22
See what’s driving market performance around the world in today’s Morning Lineup. Bespoke’s Morning Lineup is the best way to start your trading day. Read it now by starting a two-week trial to Bespoke Premium. CLICK HERE to learn more and start your trial.
“You should welcome a bear market, since it puts stocks back on sale.” – Jason Zweig

Below is a snippet of content from today’s Morning Lineup for Bespoke Premium members. Start a two-week trial to Bespoke Premium now to access the full report.
It’s a very mixed picture for equity futures this morning with the Dow indicated up pretty sharply while the Nasdaq is down by a similar magnitude driven in large part by shares of Meta Platforms (META) which is down over 20% and struggling to hang on to triple-digits. The ECB just announced its policy decision and hiked rates by 75 bps (as expected). Here in the US, we have a busy morning of economic data, plus big earnings reports from Amazon.com (AMZN) and Apple (AAPL) after the close.
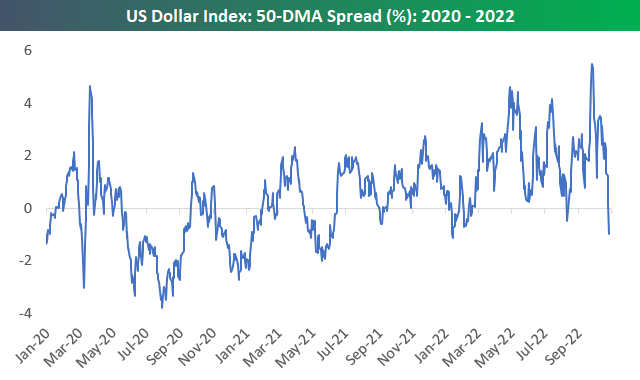
The US Dollar index peaked about a month ago, and its move lower has coincided with the bounce that we’ve seen in US equity indices. The same trend has played out over a shorter one-week time frame as well, which you can see in the Trend Analyzer snapshot below. Over the last five days, the US Dollar Bullish ETN has fallen 2.8% and broken below its 50-day moving average. At the same time, every other area of financial markets has moved higher within its trading range.

Yesterday, the US Dollar Index broke below its 50-DMA for the first time since August, and it traded the farthest below its 50-DMA since early January. As shown below, the August break did not last long, as the Dollar’s uptrend resumed almost immediately.
This morning the Dollar is back up, and a resumption of its uptrend will almost assuredly coincide with a resumption of the equity market’s downtrend. We’ll certainly be keeping an eye on FX today.

Our Morning Lineup keeps readers on top of earnings data, economic news, global headlines, and market internals. We’re biased (of course!), but we think it’s the best and most helpful pre-market report in existence!
Start a two-week trial to Bespoke Premium to read today’s full Morning Lineup.
Bespoke’s Morning Lineup — 10/26/22
See what’s driving market performance around the world in today’s Morning Lineup. Bespoke’s Morning Lineup is the best way to start your trading day. Read it now by starting a two-week trial to Bespoke Premium. CLICK HERE to learn more and start your trial.
“Solving big problems is easier than solving little problems.” – Google Co-Founder Larry Page
Below is a snippet of content from today’s Morning Lineup for Bespoke Premium members. Start a two-week trial to Bespoke Premium now to access the full report.
Bulls have finally seen some green over the last couple of weeks. In fact, the S&P 500 has gained 1%+ on six of the last nine trading days. Below is a log chart of the S&P 500 since 1952 (when the 5-day trading week began) with red dots showing prior times the index has gained 1%+ on six of the prior nine trading days (the first occurrence in at least three months). As you can see, it is not common, and aside from the occurrence in March of this year, prior periods where this happened saw massive gains over the next six and twelve months.


Our Morning Lineup keeps readers on top of earnings data, economic news, global headlines, and market internals. We’re biased (of course!), but we think it’s the best and most helpful pre-market report in existence!
Start a two-week trial to Bespoke Premium to read today’s full Morning Lineup.
Near Record Volatility in the 10-Year Yield*
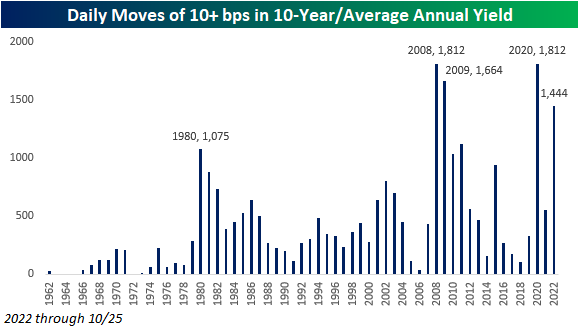
The 10-year is having another one of those days. After trading up near 4.3% intraday yesterday, the yield got as low as 4.05% this morning and is currently resting at 4.09% for a decline of 14 basis points on the day. In a normal year, we’d be talking about a move of that magnitude as a volatile day, but in 2022, it has become commonplace. Today is actually the 40th trading day this year that the 10-year yield has moved 10 bps or more relative to the prior day’s close. Relative to history, this year’s total of daily 10 bps moves (through 10/25) ranks as the highest since 2009 when there were 54. As shown in the chart below, there have been plenty of other years where the 10-year yield had a much larger frequency of 10 bps daily moves, including 2008 (66) and the early 1980s when both 1980 and 1981 had a total of 123, or roughly once every other trading day.

Based on the chart above, 2022 may look unremarkable in terms of daily volatility, but it’s leaving out a key variable and that’s the actual level of the yield on the 10-year at the time of the move. A 10 bps daily move is a lot more significant when the average yield on the 10-year is 2.8% as it has been this year compared to a year like 1980 or 1981 when the average yields were 11.4% and 13.9%, respectively. In order to adjust for the level of yield, the chart below shows the ratio of the number of days where the 10-year yield moved 10 bps versus the average yield of the 10-year during the specific year. After making that adjustment, 2022 still isn’t at a record, but it’s close. In both 2008 and 2020, the ratio was 1,812, and in 2009 it was 1,664. At 1,444, the ratio for 2022 ranks as the fourth highest on record. Already this year, 2022 ranks as one of the most volatile, in terms of daily yield changes, but there are still over two months left in the year. If the current pace continues through year-end, we could revisit this chart in just over two months and find that the ratio for this year was higher than any other year on record. Click here to learn more about Bespoke’s premium stock market research service.
Bespoke’s Morning Lineup – 10/25/22 – The Marshall Move
See what’s driving market performance around the world in today’s Morning Lineup. Bespoke’s Morning Lineup is the best way to start your trading day. Read it now by starting a two-week trial to Bespoke Premium. CLICK HERE to learn more and start your trial.
“There are a lot of mistakes made in games. That one just happened to be more visible than some of the others.” – Jim Marshall
Below is a snippet of content from today’s Morning Lineup for Bespoke Premium members. Start a two-week trial to Bespoke Premium now to access the full report.
58 years ago today, Vikings defensive end Jim Marshall recovered a 49ers fumble and ran it back to the endzone for a defensive touchdown. At least he thought it was. Unfortunately for Marshall, he ran into the wrong endzone turning what he thought was a Vikings touchdown into a safety. The Vikings still ended up winning the game, so the only people potentially impacted by Marshall’s bonehead play were the gamblers.
Less than two weeks ago, the S&P 500 closed at a new low for the year the day before what was widely anticipated as the most important economic report in weeks with the release of the September CPI on 10/13. That report was a ‘big play’ for the bears as both the headline and core readings came in higher than expected, and the y/y core reading hit a new cycle high of 6.6%. Stocks opened the day of the 13th sharply lower, and bears continued to run with it from there. Like Jim Marshall, though, they went the wrong way! The S&P 500 finished the day of the 13th up 2.6% and is now up 6.3% from its closing low on 10/12.
Despite the rally, 2022 is still a blowout as the S&P 500 remains down over 20% YTD with the Nasdaq down nearly 30%, so, like the “Purple People Eaters” of the early 1960s, the bears can still laugh about the wrong way move. The chances for Bulls this year are still slimmer than they are of Lloyd Christmas ending up with Mary Swanson, but stranger things have happened. Back in Super Bowl LI, the Falcons were up 28-3, and we all remember how that one ended. So “there’s a chance” however slim it may be.
The ‘wrong way rally’ has taken a breather this morning as futures are moderately lower ahead of a relatively busy day for economic data with Case Shiller housing numbers at 9 AM and then Consumer Confidence the Richmond Fed report at 10 AM. With the weakness in equities, treasury yields are lower and crude oil is down about 1%. The pace of earnings reports has really picked up steam and the results this morning have been somewhat lackluster. Of the nearly 40 reports so far this morning, 64% have exceeded EPS forecasts, and 62% of exceeded revenue estimates. Also slightly more companies have lowered guidance than raised it. The first big test of the earnings season will start after the close, though, when Alphabet (GOOGL) and Microsoft (MSFT) report after the close.
It seems as though this year stock prices have been driven entirely by interest rates, but a close look shows that in recent weeks that hasn’t entirely been the case. Take a look at the chart of the S&P 500. While it briefly broke below its June lows in late September and early October, it has recently rebounded and yesterday actually closed more than 3% above its June low.

If interest rates were the primary driver of stock prices, given where the S&P 500 is trading, you would expect to see the US Treasury yields right around or maybe even below the levels it was at in mid-June. That hasn’t been the case though. Take the 10-year yield, for example. At the S&P 500 lows in June, the yield on the 10-year peaked at 3.47%. It eventually fell back down to as low as 2.57% in early August, but since then has surged right through the June highs all the way up to yesterday’s high of 4.27%, or 80 basis points more than the June high. The fact that equities have been able to hang in relatively well despite the surge higher in yields suggests that stocks may be starting to look past the pressure from higher rates.

Our Morning Lineup keeps readers on top of earnings data, economic news, global headlines, and market internals. We’re biased (of course!), but we think it’s the best and most helpful pre-market report in existence!
Start a two-week trial to Bespoke Premium to read today’s full Morning Lineup.
Chinese Stocks Weigh on FAANG+
As we discussed this morning in the Morning Lineup, news out of China has sent shares of US-listed Chinese stocks tumbling. While that may sound like a concentrated issue, that weak performance actually has interesting implications for a measure of mega-cap stocks. Over the past several years, the NYSE FAANG+ Index has been a well-tracked measure of the mega caps and two members of that index are two of the largest Chinese stocks: Alibaba (BABA) and Baidu (BIDU). Given the index is equal weight, the declines of more than 14% in both stocks today are not weighing too heavily on the index, but we would note their performance drastically changes what would otherwise be a somewhat optimistic-looking chart.
Below we show the NYSE FAANG index as normal and without those Chinese stocks over the past year both indexed to 100 one year ago. The original index (red line) remains firmly in its downtrend over the long term and since the summer. However, when BIDU and BABA are removed (blue line), that summer downtrend has definitively been broken. That is not to say mega-caps have completely reversed the long-term picture, but the FAANG stocks’ short-term chart might be more positive than at face value.

Turning to the individual FAANG stocks’ charts, Microsoft (MSFT) and Apple (AAPL), which as we discussed in today’s Chart of the Day, are scheduled to report on Tuesday and Thursday, respectively, have begun to break out of their summer/fall downtrends. While that is a positive development at least in the near term, there is still resistance ahead at each stock’s moving averages. With the potential catalysts of earnings, later this week we should have a better idea of whether or not those breakouts are pump fakes or the start of something more material.


While those mega-cap moves have been promising to a degree, Amazon (AMZN) has been met with the opposite fate. AMZN likewise attempted to break out of the past few months’ downtrend in the past few days, but today, it has met resistance.

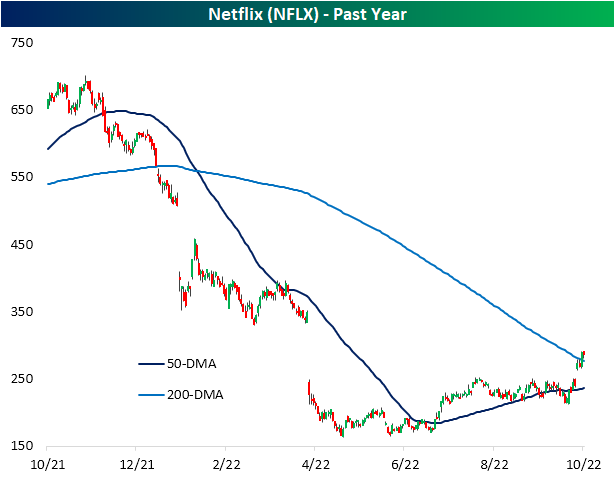
As for another FAANG member that has already reported, Netflix’s (NFLX) recent chart developments have been even more constructive. After a double-digit percentage jump in response to stronger-than-expected subscriber growth last week, NFLX has moved above both its 50 and 200-DMAs and is now filling the massive gap down from its April earnings report when it declined 35% in a single day. Of course, there is plenty of progress left to be made to erase the massive declines of the past year, but the move higher this earnings season has been a welcome relief. Click here to learn more about Bespoke’s premium stock market research service.
Bespoke’s Morning Lineup – 10/24/22 – A Strong Start
See what’s driving market performance around the world in today’s Morning Lineup. Bespoke’s Morning Lineup is the best way to start your trading day. Read it now by starting a two-week trial to Bespoke Premium. CLICK HERE to learn more and start your trial.
“Diversity in the world is a basic characteristic of human society, and also the key condition for a lively and dynamic world as we see today.” – Hu Jintao
Below is a snippet of content from today’s Morning Lineup for Bespoke Premium members. Start a two-week trial to Bespoke Premium now to access the full report.
It’s been a roller-coaster morning for US equity markets since futures opened for trading last night. After opening sharply higher, futures drifted lower all morning before bottoming out between 4 AM and 6 AM eastern time. Investors remain optimistic following Friday’s surprise WSJ ‘leak’ of the potential for a Fed pause to rate hikes later this year. While the Fed is moving markets this morning, earnings are likely to take a more front-and-center role this week as more than 150 S&P 500 companies are set to report this week, including the largest companies in the index. On the economic calendar, the only reports of note are the Chicago Fed National Activity Index and the flash S&P Manufacturing PMI.
While free markets are all rallying this morning, the same can’t be said for Chinese markets where Xi’s consolidation of power at the national party congress after his predecessor Hu Jintao was unceremoniously escorted out has investors running for the exits. Hu Jintao may have said in his comments that he advocated for diversity, but Chairman Xi has consolidated power into a tight group composed entirely of loyalists to his views. The KraneShares CSI China Internet ETF (KWEB) is trading down below $20 per share today to all-time lows and is down 82% from its all-time high in February 2021. That’s an even larger drawdown than the Nasdaq had from the dot-com bust!

Today’s new low in the KWEB comes from what is poised to be a 12.5% decline at the open, which, if it holds up through the close, would be the largest single-day decline in the ETF’s history going back more than 20 years!

The Chinese currency has also been under considerable pressure lately. In today’s trading, the renminbi exchange rate rose above 7.26 which is the weakest level since January 2008, taking out the lows seen in the year leading up to COVID when President Trump began the trade war with the country.

Our Morning Lineup keeps readers on top of earnings data, economic news, global headlines, and market internals. We’re biased (of course!), but we think it’s the best and most helpful pre-market report in existence!
Start a two-week trial to Bespoke Premium to read today’s full Morning Lineup.
Bespoke Brunch Reads: 10/23/22
Welcome to Bespoke Brunch Reads — a linkfest of the favorite things we read over the past week. The links are mostly market related, but there are some other interesting subjects covered as well. We hope you enjoy the food for thought as a supplement to the research we provide you during the week.
While you’re here, join Bespoke Premium with a 30-day trial!
Energy
The Case for Energy Optimism by Alex Turnbull (Syncretia)
A contrarian case that not only is the worst of the energy shock stemming from the Russian invasion behind us, but that other supply problems related to the energy transition are unlikely to be truly persistent. [Link]
Dozens of LNG-laden ships queue off Europe’s coasts unable to unload by Marwa Rashad and Belén Carreño (Reuters)
Dozens of giant ships filled with super-cooled natural gas are waiting for unloading in Europe, where regassification capacity is tight and storage is rapidly filling ahead of the peak demand period this winter. [Link]
BBC prepares secret scripts for possible use in winter blackouts by Severin Carrell and Jim Waterson (The Guardian)
Ahead of a winter where the UK is likely to suffer severe electrical grid pressure, the national broadcaster is preparing scripts discussing the energy shortages. [Link]
Axium Infrastructure and Canadian Solar’s Subsidiaries Recurrent Energy and CSI Energy Storage Announce Operation of World’s Largest Single Phase Energy Storage Project (Seeking Alpha/PR Newswire)
The world’s largest grid-scale storage project is now operating in California, with enough capacity to power tens of thousands of homes. The project will allow the grid to bridge electricity between peak production mid-day and peak demand in the evening. [Link]
Central Banks
Tug of War That Markets Fear Is Central Banks Versus Governments by Ben Holland and Liz Capo McCormick (Yahoo!/Bloomberg)
Central banks are rapidly raising rates to flight inflation even as fiscal authorities loosen policy in order to soften the blow of higher costs for critical standard of living goods, creating a push and pull that stands in stark contrast to the lockstep monetary and fiscal policy of the pandemic era. [Link]
British U-Turn Shows Central Banks Still Rule (and That’s Not Always Good) by Jon Sindreu (WSJ)
The Bank of England refused to provide more runway for the new Conservative Prime Minister’s fiscal plans, illustrating the power central banks still have over governments. [Link; paywall]
Big Narratives
We Will See the Return of Capital Investment on a Massive Scale by Mark Dittli (The Market)
Market strategist Russell Napier, who long believed in a disinflationary global cycle, is worried that a capital investment boom that will eventually lead to stagflation. [Link]
Active Trading
As Covid Hit, Washington Officials Traded Stocks With Exquisite Timing by Rebecca Ballhaus, Joe Palazzolo, Brody Mullins, Chad Day, and John West (WSJ)
Privy to all sorts of non-public information, civil servants across the government busily traded as markets fell and rose, delivering some impressive calls. [Link; paywall]
Day Traders Go Back to Their Day Jobs as Stock Market Swoons by Peter Rudegeair and Gunjan Banerji (WSJ)
The massive stock market craze in the wake of COVID is not continuing, as the bear market pushes active day traders out of their brokerage accounts and back into the labor force. [Link; paywall]
Demographics
The COVID-19 Baby Bump: The Unexpected Increase In U.S. Fertility Rates In Response To The Pandmeic by Martha J. Bailey, Janet Currie, and Hannes Schwandt (NBER)
Birth rates plunged during the pandemic, with a bottoming out 9 months after the onset of COVID. But fertility then took off, with the first sustained sequential increase in years for the US, especially among US born women. [Link; 38 page PDF]
College Enrollment Declines Again Though Online Schools, HBCUs See Increases by Douglas Belkin (WSJ)
Over the past three years college enrollment has plunged, with 1.5mm fewer students than pre-pandemic. Enrollment was already falling before the pandemic, but declines appear to have accelerated in its wake. [Link; paywall]
Work From Home and The Office Real Estate Apocalypse (NBER)
This working paper estimates the pandemic reduced the value of NYC office buildings by 45% and the shift towards working from home would push NYC office asset prices to a level roughly 40% lower than pre-pandemic. [Link; 77 page PDF]
Greenback Woes
How the surging U.S. dollar is making it almost impossible to afford anything in countries around the world by Paul Wiseman, Kelvin Chan, Samy Magdy, and Ayse Wieting (Fortune/AP)
A soaring dollar is crushing currencies around the world, exacerbating the already-severe cost of living shock that was brought on by the invasion of Ukraine. [Link]
Supply Chains
Ikea hikes prices by up to 80% blaming ‘surging’ transport and material costs by Sam Courtney-Guy (Metro)
Prices at Ikea in the UK are going up dramatically in response to the collapsing pound, soaring transport costs, and high inflation for raw materials. [Link]
Freight Operators’ Peak Shipping Season Is Crumbling by Paul Berger and Paul Page (WSJ)
Cancelled shipments of imports, low inventories, and slower shipping through-put mean the busy season for trucking lines across the country is coming in much slower than expected. [Link]
Read Bespoke’s most actionable market research by joining Bespoke Premium today! Get started here.
Have a great weekend!
Price and Breadth Blowout Into the Weekend
In today’s Morning Lineup, we noted the consistency in which the S&P 500 has finished the week with a decline of 1% or larger this year. Today is not looking to add to that count as the index rallies well over 2%, but it would make for the twelfth week this year and third in a row in which the index has gone into the weekend with a move of 2% or more in absolute terms. As shown below, the only years of the past 70 with a comparable number of weeks has been 2000 (11) and 2008 (12).

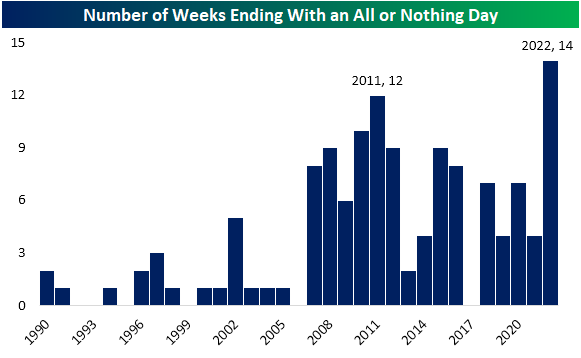
In addition to moving over 2% in absolute terms, there has been breadth to boot. The last three Fridays have been “all or nothing” days (daily advance-decline reading of +/-400). In total on the year, there have now been 14 weeks to end with an “all or nothing” day. No other year since at least 1990 has seen as many with 2011 the closest at 12 weeks. Further, the only other times that there have been similar streaks to the current one were in 2011 and 2016. Click here to learn more about Bespoke’s premium stock market research service.

Bespoke’s Morning Lineup — 10/21/22 — Friday Markets Incoming
See what’s driving market performance around the world in today’s Morning Lineup. Bespoke’s Morning Lineup is the best way to start your trading day. Read it now by starting a two-week trial to Bespoke Premium. CLICK HERE to learn more and start your trial.
“In the history of every great catastrophe, you will find that some masterly bit of stupidity sets fire to the oil-soaked rags.” – Edwin Lefèvre
Below is a snippet of content from today’s Morning Lineup for Bespoke Premium members. Start a two-week trial to Bespoke Premium now to access the full report.
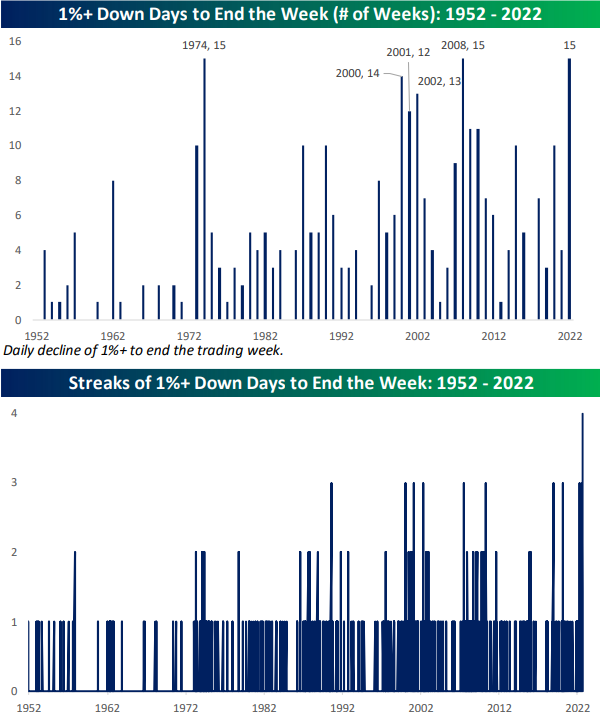
It’s Friday, so yes, US equity futures are down. As shown below, the S&P 500 has already seen 15 weeks end with a 1%+ down day in 2022, which is tied for the record seen back in 1974 and 2008. A 1%+ down day today would make it a record 16, and there are still 10 weeks left in the year! Keep in mind that we’ve also seen four straight weeks end with a 1% down day coming into this week, which would extend to five if the S&P indeed falls 1%+ again today.
Our Morning Lineup keeps readers on top of earnings data, economic news, global headlines, and market internals. We’re biased (of course!), but we think it’s the best and most helpful pre-market report in existence!
Start a two-week trial to Bespoke Premium to read today’s full Morning Lineup.
The Bespoke Report – 10/20/22 – Recession Secured
This week’s Bespoke Report newsletter is now available for members.
This week was a bit of an in-betweener as the economic calendar was extremely light (there are no reports on the calendar for Friday), and we’re still a couple of weeks from the peak earnings season. With respect to the data we did see, housing data, the index of leading indicators, and movements in various points on the yield curve suggest that a recession is imminent if we aren’t already in one. Earnings results told a different story, though. Maybe it’s just a factor of low expectations, but companies reporting so far have delivered predominantly better-than-expected reports. Even stranger in some respects was the fact that through Thursday, stocks were actually up on the week!
You’ll definitely want to read this week’s Bespoke Report if you’re looking for help understanding what’s going on in markets these days. To read this week’s full Bespoke Report newsletter and access everything else Bespoke’s research platform has to offer, start a two-week trial to one of our three membership levels.

