The Bespoke 50 Growth Stocks — 11/3/22
The “Bespoke 50” is a basket of noteworthy growth stocks in the Russell 3,000. To make the list, a stock must have strong earnings growth prospects along with an attractive price chart based on Bespoke’s analysis. The Bespoke 50 is updated weekly on Thursday unless otherwise noted. There were five changes to the list this week.
The Bespoke 50 is available with a Bespoke Premium subscription or a Bespoke Institutional subscription. You can learn more about our subscription offerings at our Membership Options page, or simply start a two-week trial at our sign-up page.
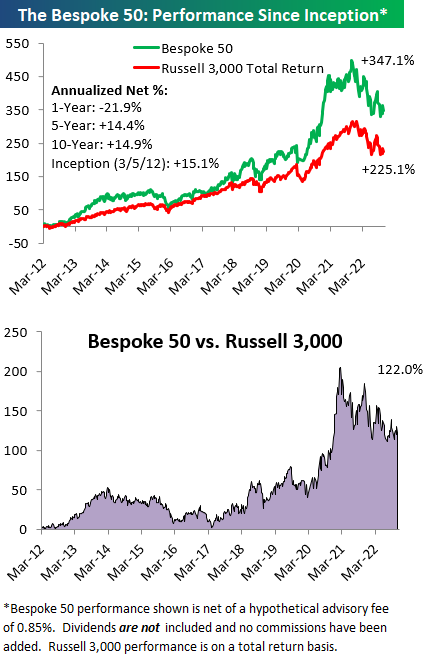
The Bespoke 50 performance chart shown does not represent actual investment results. The Bespoke 50 is updated weekly on Thursday. Performance is based on equally weighting each of the 50 stocks (2% each) and is calculated using each stock’s opening price as of Friday morning each week. Entry prices and exit prices used for stocks that are added or removed from the Bespoke 50 are based on Friday’s opening price. Any potential commissions, brokerage fees, or dividends are not included in the Bespoke 50 performance calculation, but the performance shown is net of a hypothetical annual advisory fee of 0.85%. Performance tracking for the Bespoke 50 and the Russell 3,000 total return index begins on March 5th, 2012 when the Bespoke 50 was first published. Past performance is not a guarantee of future results. The Bespoke 50 is meant to be an idea generator for investors and not a recommendation to buy or sell any specific securities. It is not personalized advice because it in no way takes into account an investor’s individual needs. As always, investors should conduct their own research when buying or selling individual securities. Click here to read our full disclosure on hypothetical performance tracking. Bespoke representatives or wealth management clients may have positions in securities discussed or mentioned in its published content.
Jobless Claims Snoozer
Jobless claims continue to be a snoozer. Headed into tomorrow’s nonfarm payrolls report, initial jobless claims were little changed falling 1K down to 217K. Over the past month, claims have been in a relatively tight range of only 12K. That is the tightest one-month range since late June/early July, albeit claims are at slightly healthier levels than back then as well.

On a non-seasonally adjusted basis, claims are at 185.6K, which is the lowest level since 1969 for the comparable week of the year. Claims have been on the move higher as is the norm for the point of the year. In fact, the current week of the year has been one of the most frequent to see week-over-week increases in unadjusted jobless claims with increases 83% of the time since 1967.

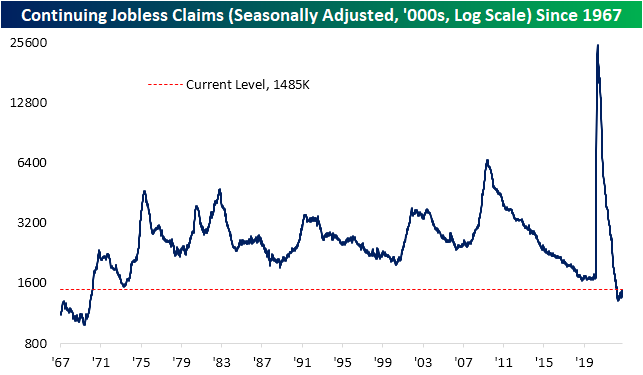
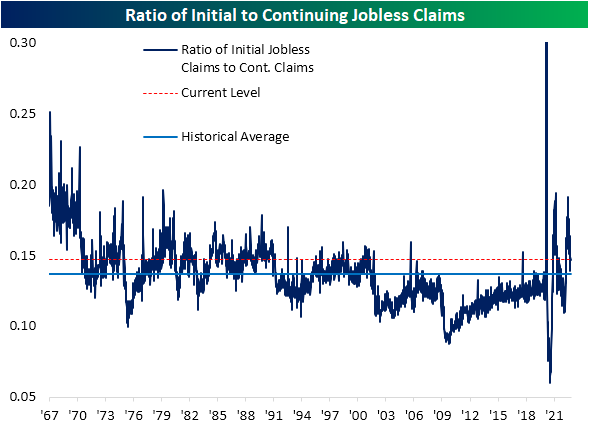
While initial jobless claims have not seen particularly large moves recently, the picture for continuing claims has begun to shift. Although continuing claims are much further below their pre-pandemic range than initial claims, the most recent week saw a move up to 1.485 million which is the highest level since the end of March. As a result, the ratio of initial to continuing claims has moved sharply lower and is closing in on its historical average. That compares to earlier this year when initial claims were running at much weaker levels than continuing claims implying little follow-through on initial claims. Click here to learn more about Bespoke’s premium stock market research service.
Bears Down By 20
Given the collection period, the latest sentiment data from the weekly American Association of Individual Investors survey would not have fully captured the FOMC meeting yesterday or the market’s reaction to the event. As a result, with the S&P 500 having erased a large portion of late September and early October losses, sentiment took a massive bullish swing. Bullish sentiment gained 4 percentage points for the third weekly increase in a row. Bullish sentiment topped 30% for the first time since the week of August 18th.
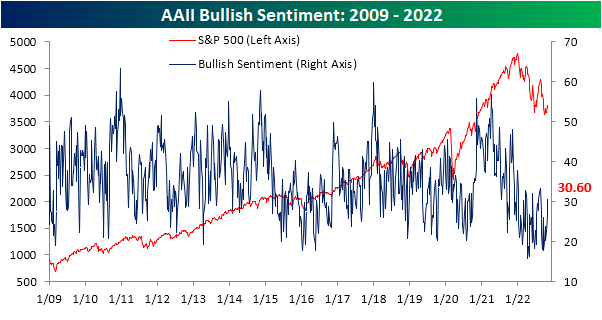
Relative to the moves in bearish sentiment, those gains to bulls are outright modest. In the past two weeks, bearish sentiment has seen back to back double digit declines, bringing it from 56.2% all the way down to 32.9%; the lowest level since the end of March. That was the first time that bearish sentiment has seen back to back declines of at least 10 percentage points since 2009, and further back in the history of the survey that has only happened two other times: June 2004 and in the first year of the survey in September 1987.

While back to back double digit declines for bearish sentiment are exceedingly rare, there has been more precedent for bearish sentiment falling at least 20 percentage points in a two week span. In the table below, we show each occurrence that has happened with at least 3 months between the prior occurrence.
As for how the S&P 500 has typically reacted, forward performance has been lackluster.

Given the massive drop in bearishness, the bull bear spread has experienced a massive reversal. At the moment, the spread is only at -2.3. That is the highest reading since the end of March, and the near record streak of consecutive negative readings (31 weeks) appears to be at risk.

Obviously considering only a small share of the losses to bears have gone to bulls, the percentage of respondents reporting neutral sentiment has risen sharply. The reading climbed 8.8 percentage points week over week to 36.5%. That is the highest reading and largest weekly jump since the end of March Click here to learn more about Bespoke’s premium stock market research service.

Bespoke’s Consumer Pulse Report — November 2022
Bespoke’s Morning Lineup – 11/3/22 – Post Fed Hangover Continues
See what’s driving market performance around the world in today’s Morning Lineup. Bespoke’s Morning Lineup is the best way to start your trading day. Read it now by starting a two-week trial to Bespoke Premium. CLICK HERE to learn more and start your trial.
“Be innovative. Don’t listen to the tried and tested wisdom. Take a risk!” – Daniel Libeskind

Below is a snippet of content from today’s Morning Lineup for Bespoke Premium members. Start a two-week trial to Bespoke Premium now to access the full report.
A horrible market reaction to yesterday’s Fed meeting is getting even worse this morning as futures have been weakening throughout the morning and are now indicating a decline of 1% at the open. It’s a busy day of economic data, and Unit Labor Costs were weaker than expected (3.5% vs 4.0%) while Initial Jobless Claims were basically in line with expectations (217K vs 220K). Still on the docket, we have ISM Services at 10 AM where economists are forecasting a drop in the headline reading from 56.7 down to 55.4.
As noted in the Closer last night, yesterday’s post-Fed sell-off (-3.22%) was the worst performance for the S&P 500 in the final 90 minutes of trading on a Fed day going all the way back to 1994 when the FOMC first started announcing their interest rate policies on the day of the meeting.

As a result of yesterday’s sell-off, the S&P 500 finished the day down 2.5% which was the 21st time the index has been down 2% or more this year. While there are still nearly two full months left in the year, 2022 already ranks as the fifth most number of 2%+ daily declines since the five-trading day week was established in 1952. The only years with more 2% declines were 2008 (41), 2002 (29), 2009 (28), and 2020 (2025). 2008’s total is out of reach at this point, but if volatility persists between now and year-end, the spots of any of those other years are up for grabs.

Our Morning Lineup keeps readers on top of earnings data, economic news, global headlines, and market internals. We’re biased (of course!), but we think it’s the best and most helpful pre-market report in existence!
Start a two-week trial to Bespoke Premium to read today’s full Morning Lineup.
Record Decline in Mortgage Apps
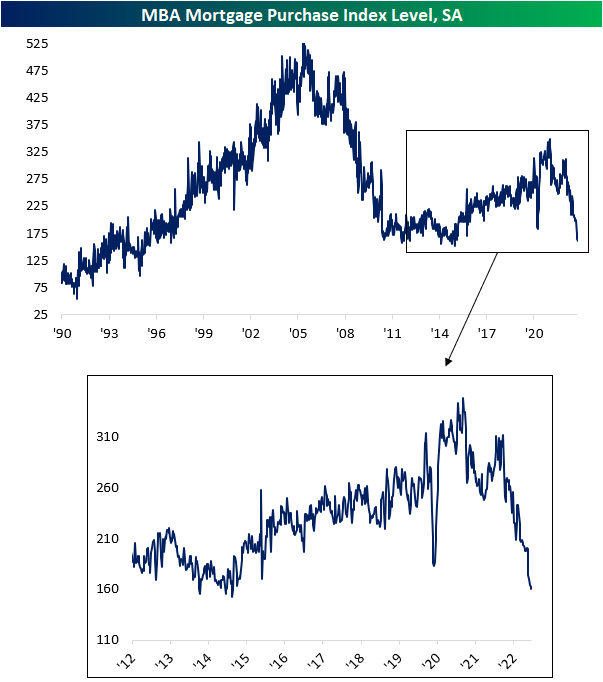
As mortgage rates continue to press higher with Bankrate.com’s 30 year national average for a fixed rate loan hovering well above 7%, high frequency housing data continues to show no signs of relief. The latest mortgage purchase reading from the Mortgage Bankers Association released this morning showed the lowest level of applications since the start of 2015. As we mentioned in today’s Morning Lineup, that would imply further significant declines in new and existing home sales data to come.
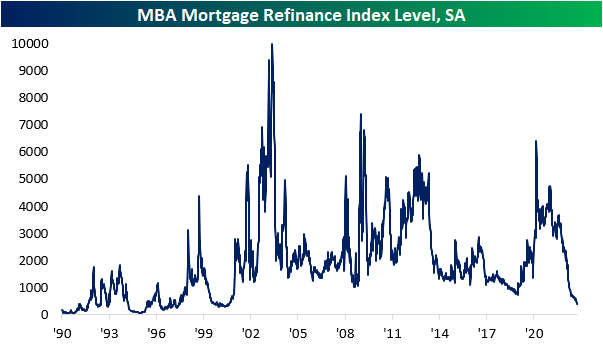
Refinance applications are even worse. Given homeowners would be refinancing at some of the highest rates of the past few decades, refinance applications were up modestly week over week, although that is far from enough to lift it off of the lowest levels since August 2000.
On a non-seasonally adjusted basis, purchases tend to peak in the late spring followed by a gradual decline through the end of the year. While mortgage activity has fallen off of a cliff this year, the drop has followed the usual seasonal pattern. What is amazing about this year is just how large of a drop that has been. Whereas 2022 started with purchase apps coming in at some of the strongest levels of the past decade for the comparable weeks of the year, the opposite is true today.

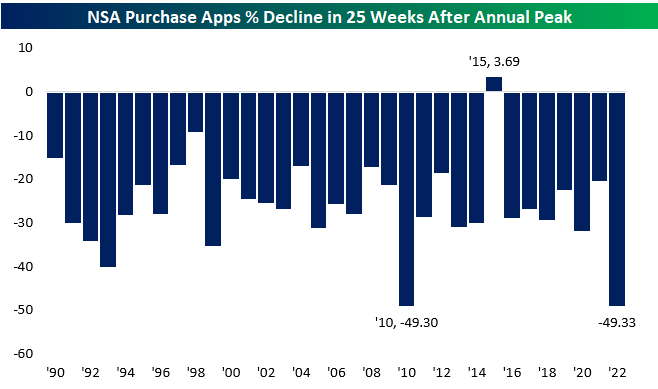
Although purchases have followed their seasonal pattern, the chart above does not do justice in showing how large of a decline it has been off of the annual peak. It has been nearly half a year (25 weeks) since applications hit their seasonal high, and in that time, purchases have been essentially cut in half. Relative to the 25 weeks after each other annual high since 1990, 2010 was the only other year in which there was a similar decline. However, that year comes with a caveat that the expiration of special homebuyer tax credits lent to a particularly strong home-buying season. Similarly, a change in mortgage disclosure rules in the fall of 2015 resulted in a seasonal peak occurring unusually late in the fall of that year, so 25 weeks later extended out to the following year. Given that, purchases were actually higher in the 25 weeks later; the only year in which that is the case. In other words, caveats aside, no other year in the history of this data has seen as sharp of a decline in homebuying/mortgage origination activity as this year. Click here to learn more about Bespoke’s premium stock market research service.
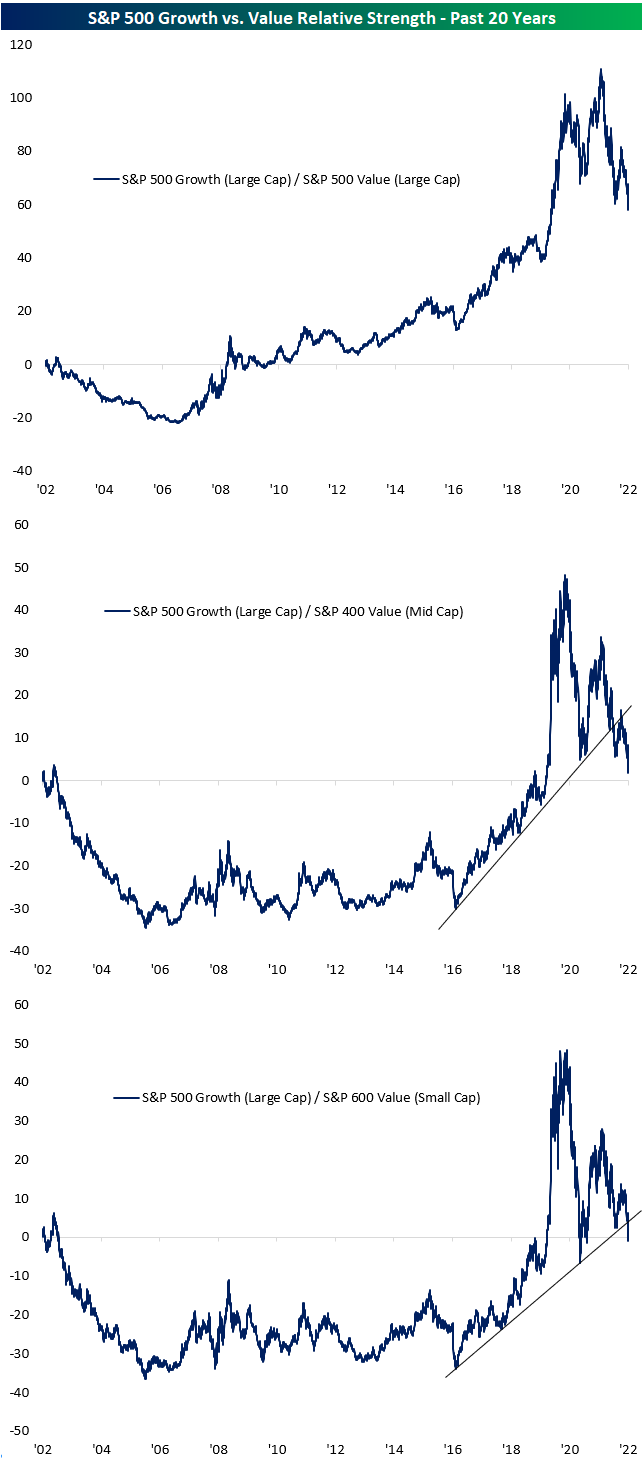
Large Cap Growth Underperforms Everything
The past year has been a rough road for equities, but growth in particular has certainly seen its fair share of underperformance. The past month especially has been a notable microcosm of that underperformance. As we approach the one-year mark of the last all-time high in growth-oriented indices like the Nasdaq (discussed in today’s Chart of the Day) or S&P 500 Growth index, large-cap growth’s relative strength has broken down versus equities broadly, as well as growth and value across various market cap ranges.
As shown below, S&P 500 Growth relative to the S&P 500 steadily moved higher (upwards trending lines indicate S&P 500 growth outperformance) throughout the post-Global Financial Crisis era and absolutely took off in the early stages of the pandemic. After peaking in November of last year, the relative performance of growth has been on the downswing and erasing most of its earlier pandemic outperformance. In fact, following the historic weakness of mega caps on earnings (which we discussed in last week’s Bespoke report) that has continued into this week, and the relative strength is now at the lowest level since the end of February 2020.

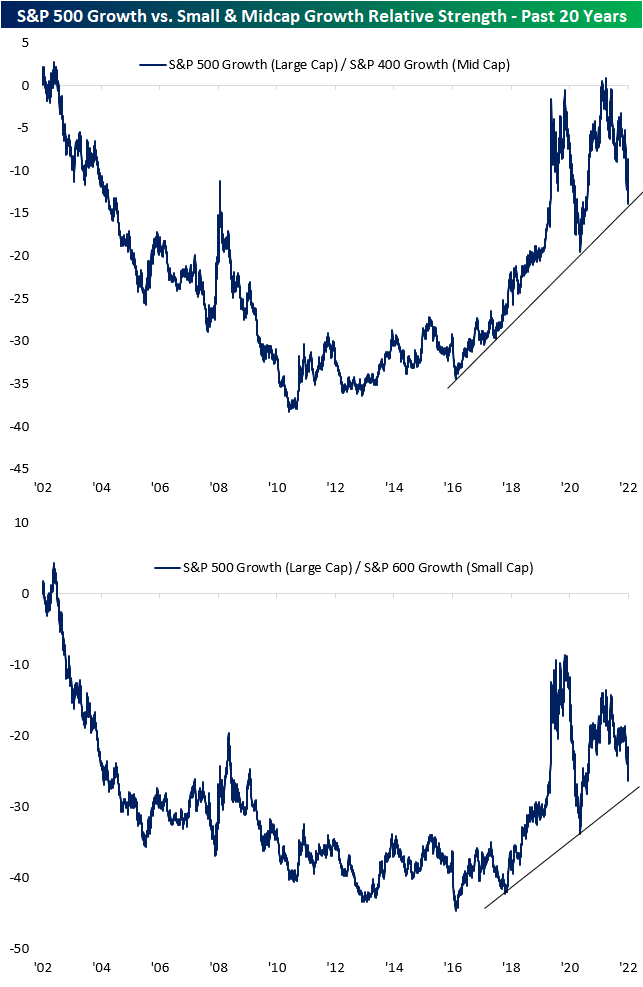
Large-cap growth has not only underperformed other large caps, but it has also dramatically underperformed its mid and small-cap peers. From the post-Dot Com Bubble years through the Global Financial Crisis period, large-cap growth serially underperformed growth stocks of both the mid and small-cap varieties. The past decade, however, erased much of that underperformance. In fact, the 20-year relative strength line of S&P 500 growth versus S&P 400 growth actually turned positive briefly earlier this year in February. In other words, after almost two decades the performance of large-cap (S&P 500) and mid-cap (S&P 400) growth was finally near equal. Since then, the relative strength line has pivoted sharply lower and is now testing the uptrend line that has been in place since 2016.
Relative to small-cap growth, large-cap growth was much weaker in the first half of the 2010s and didn’t really begin to turn higher until the past five years. With that said, it also peaked far earlier (September 2020) than the relative strength versus mid-cap growth and is not quite testing its multiyear uptrend line yet.
Where the more dramatic underperformance of large-cap growth has been is relative to value stocks. As shown in the first chart below, relative to large-cap value, large-cap growth generally remains in its longer-term uptrend although most post-pandemic outperformance has been erased. Moving down the market cap chain increasingly worsens that picture through. The relative strength line of S&P 500 growth versus S&P 400 value recently hit a new low for the post-pandemic period, nearing the flatline in the process. In other words, large-cap growth has almost erased all of its outperformance versus mid-cap value, not only since the start of the pandemic but over the past 20 years. As for small caps, that outperformance is now gone entirely gone as the relative strength line now registers negative readings. Both versus mid and small-cap value, large-cap growth has definitively broken its multi-year uptrends that had been in place since late 2016. Click here to learn more about Bespoke’s premium stock market research service.
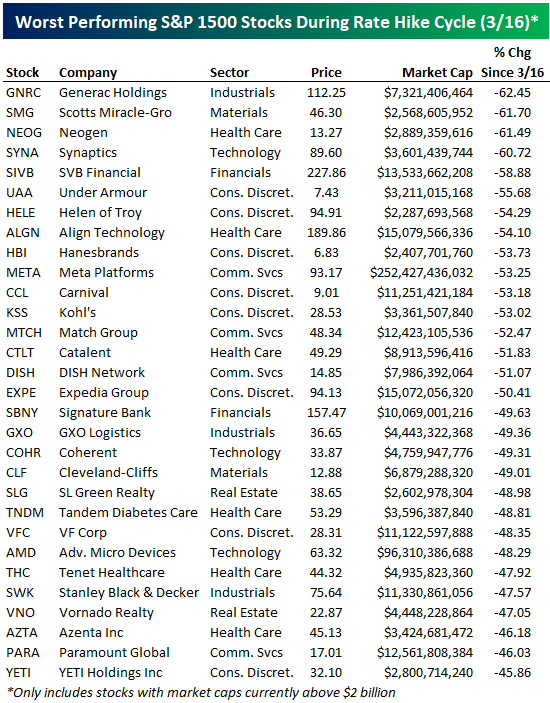
Best and Worst Performing Stocks Since Rate Hikes Began
The S&P 500 is down a little more than 12% since the close on March 16th after Fed Chair Powell hiked rates off the zero bound for the first time of this cycle. We’ve seen 300 basis points of hikes so far, and today we’re set for another hike of 75 bps.
Looking at the S&P 1500, which includes large-caps, mid-caps, and small-caps, the average stock in the index is down 7.1% since the close on March 16th after the first rate hike. As shown below, Real Estate stocks (REITs) have been hit the hardest by the rate hikes with the average stock in the sector down 20.6%. Communication Services stocks are down the second most with an average decline of 18.4%. Consumer Discretionary stocks have averaged a decline of 13.1% since 3/16, while Technology stocks are down 10.6%. On the upside, we’ve seen two sectors average gains since the Powell rate hike cycle began: Energy and Consumer Staples. Consumer Staples stocks are up an average of 5.6%, while Energy stocks have averaged a huge gain of 24.8%. Click here to learn more about Bespoke’s premium stock market research service.

Below is a list of the stocks in the S&P 1500 with market caps above $2 billion that have done the best since rate hikes began back in March. PBF Energy (PBF) is up the most with a gain of 135.99%, while CONSOL Energy (CEIX) ranks second with a gain of 114.49%. Other notable stocks on the list of big winners include First Solar (FSLR), Constellation Energy (CEG), Shockwave Medical (SWAV), Enphase Energy (ENPH), Lamb Weston (LW), H&R Block (HRB), TreeHouse Foods (THS), Exxon Mobil (XOM), and Albemarle (ALB).

On the flip side, below is a list of the stocks with market caps still above $2 billion that have fallen the most since the rate hike cycle began. Leading the list is portable generator maker Generac (GNRC) with a decline of 62.45%, followed by two more stocks down more than 60%: Scotts Miracle-Gro (SMG) and Neogen (NEOG). Other notables on the list of rate-hike losers include Under Armour (UAA), Align Tech (ALGN), Meta Platforms (META), Carnival (CCL), Kohl’s (KSS), Expedia (EXPE), Cleveland-Cliffs (CLF), VF Corp (VFC), AMD, Paramount (PARA), and Yeti (YETI). Click here to learn more about Bespoke’s premium stock market research service.
Fixed Income Weekly: 11/2/22
Searching for ways to better understand the fixed income space or looking for actionable ideas in this asset class? Bespoke’s Fixed Income Weekly provides an update on rates and credit every Wednesday. We start off with a fresh piece of analysis driven by what’s in the headlines or driving the market in a given week. We then provide charts of how US Treasury futures and rates are trading, before moving on to a summary of recent fixed income ETF performance, short-term interest rates including money market funds, and a trade idea. We summarize changes and recent developments for a variety of yield curves (UST, bund, Eurodollar, US breakeven inflation and Bespoke’s Global Yield Curve) before finishing with a review of recent UST yield curve changes, spread changes for major credit products and international bonds, and 1 year return profiles for a cross section of the fixed income world.
In this week’s report we discuss how sensitive the stock market is to near-term rate changes versus terminal rate changes.

Our Fixed Income Weekly helps investors stay on top of fixed income markets and gain new perspective on the developments in interest rates. You can sign up for a Bespoke research trial below to see this week’s report and everything else Bespoke publishes free for the next two weeks!
Click here and start a 14-day free trial to Bespoke Institutional to see our newest Fixed Income Weekly now!
Bespoke’s Morning Lineup – 11/2/22 – All You Can Eat 75 Bps
See what’s driving market performance around the world in today’s Morning Lineup. Bespoke’s Morning Lineup is the best way to start your trading day. Read it now by starting a two-week trial to Bespoke Premium. CLICK HERE to learn more and start your trial.
“A 75-basis point increase is not something that the committee is actively considering” – Jerome Powell
Below is a snippet of content from today’s Morning Lineup for Bespoke Premium members. Start a two-week trial to Bespoke Premium now to access the full report.
Futures have been fluctuating around the unchanged line this morning, and a stronger-than-expected ADP Private Payrolls report earlier currently has them on the south end of the flatline. Treasury yields are also in a holding pattern ahead of the Fed later today and the 10-year yield is a few basis points above 4%.
In his post-meeting press conference on May 4th, Jerome Powell, after hiking rates by what at the time was an abnormally large 50 basis points (bps), put investors at ease by telling CNBC’s Steve Liesman that the committee wasn’t’ actively considering a 75-bps rate hike. As the headlines the next day read, 75 bps was ‘off the table’. In the six months since those comments were made, it has been an all-you-can-eat buffet of 75 bps hike, and the overwhelming consensus is that today will be the fourth such hike of that magnitude. In fact, CME’s FedWatch tool currently puts the odds of a hike of less than 75 bps at just 12.5%.
What changed after May 4th that caused the Fed to shift direction so sharply? Well, it all started back in early to mid-June when gas prices were up over 50% YTD and a University of Michigan preliminary report showed a surge in inflation expectations. Fed officials became increasingly worried that expectations were becoming unmoored raising fears of a 1970s-type spiral. Since the committee was in a blackout period, they ‘leaked’ news to the WSJ that a 75-bps hike was the likely course of action at its meeting later that week. On the 15th of June, the FOMC did in fact hike rates 75 bps in what would become the first in a run of hikes of that magnitude.
It turns out that June 13th marked the YTD peak in gas prices (they have since declined 25%), and the spike in inflation expectations from the preliminary Michigan Confidence report was revised away. In the historical data, it doesn’t even exist anymore! Even compared to the revised reading for both the 1-year and 5-10 year periods, inflation expectations are lower now than they were in June. In other words, the two primary catalysts for the Fed put a 75 bps hike back on the table have reversed, and yet, the FOMC not only hiked rates 75 bps once but is on pace to hike rates by that amount for a fourth time today.
Who knows where interest rates should or shouldn’t be, but the inconsistency between comments made just six months ago and their actions since then is stark. Markets will likely have notable moves in either direction today based on what Powell and the committee say today, but don’t be too quick to chisel anything into stone.
What we can say for sure is that over the last six months, the move in the 3-month US Treasury yield has been extreme. With an increase of over 325 bps, it has been the largest six-month increase in the yield since May 1981. Going back to 1961, there have only been 147 trading days (less than 1% of all days) where the six-month rate of change was higher than it is now. As shown in the chart below, those readings were from a brief period in 1973 and then intermittently throughout a two-year period from 1979 to 1981.

Our Morning Lineup keeps readers on top of earnings data, economic news, global headlines, and market internals. We’re biased (of course!), but we think it’s the best and most helpful pre-market report in existence!
Start a two-week trial to Bespoke Premium to read today’s full Morning Lineup.