Bespoke Market Calendar — February 2023
Please click the image below to view our February 2023 market calendar. This calendar includes the S&P 500’s historical average percentage change and average intraday chart pattern for each trading day during the upcoming month. It also includes market holidays and options expiration dates plus the dates of key economic indicator releases. Click here to view Bespoke’s premium membership options.

10 Names For Half the Move
Taking tabs on the strong first month of the year, at multiple points in the past day we highlighted (see here, here, and here) which areas were the best performing parts of the market. In January, sectors like Tech, Communication Services, and Consumer Discretionary saw massive outperformance following the opposite playing out throughout 2022. Another significant point to these sectors is that they are home to some of the largest stocks in the S&P 500 by market cap; meaning those largest stocks have outsized impacts on the moves in the market cap-weighted S&P 500. As such, a massive portion of the S&P 500’s gains in January came from only a handful of names.
In the table below, we show the ten stocks which had the largest impacts on the S&P 500 index level moves. With double-digit percentage rallies during the month, the largest stocks in the index with market caps of more than $1 trillion like Apple (AAPL) and Amazon (AMZN) top the list. Those two alone accounted for over a fifth of the S&P’s gains in January. Impressively, adding in the rest of the top ten largest contributors (which account for roughly a third of the S&P 500’s total market cap) shows that those ten names combined had nearly the same impact as the hundreds of other stocks that make up the index.


Although mega caps, and thus a handful of sectors, have provided an outsized boost to the S&P 500 to start out the year, the market’s rally has still been broad-based as breadth has been quite positive. As shown below, the S&P 500’s cumulative advance-decline (A/D) line has been grinding higher and making new highs even as price has not been as strong. In other words, a large number of stocks are moving higher even if a small number of stocks are pulling more than their fair share of the load. Click here to learn more about Bespoke’s premium stock market research service.

Home Prices Coming Down from the Summit
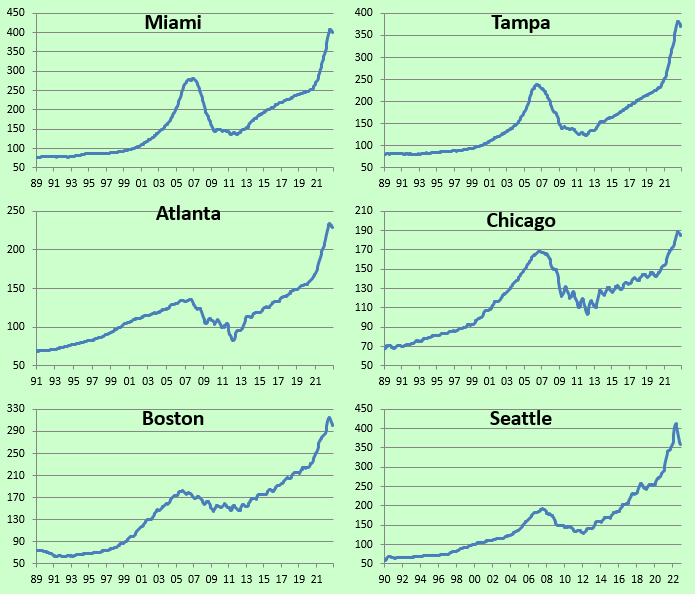
November home price data from S&P CoreLogic Case Shiller was released earlier this week, and below is an updated look at recent changes in prices across the country.
The composite and national indices all fell month-over-month (m/m) for the fifth month in a row, but the year-over-year (y/y) change in prices is still running at +6% or more. Unless prices plummet at an even faster pace over the next couple of months, we likely won’t see a negative y/y number until the March or April 2023 data is released (which won’t be until May/June since the data is released on a two-month lag).

Looking at different parts of the country, cities in the West fell the most m/m with declines of more than 1% in San Francisco, Seattle, San Diego, Phoenix, and Las Vegas. Dallas and Tampa also fell 1%+ m/m, although Miami only fell 20 bps. New York saw prices fall the least of any city at just -0.06% m/m.
Notably, while the national indices are still up 6%+ y/y, San Francisco is the first city to fall into the red on a y/y basis with a decline of 1.57% in prices from November 2021 to November 2022. Tampa and Miami home prices are still up the most y/y with gains of 16.85% and 18.41%, respectively.
We also show how much prices are up since February 2020 just before COVID began as well as how much prices have now fallen from their post-COVID peaks. The national indices are all still up more than 30% from pre-COVID levels, and so far they’ve fallen around 5% from their highs. San Francisco and Seattle have seen the biggest drops in prices with declines of more than 13%, while New York, Chicago, Miami, and Atlanta have seen prices fall the least.


Below are historical price charts of the Case Shiller home price indices for all of the cities covered. While prices look to have peaked, you can see that they’re still extremely elevated relative to any point over the last 30+ years, including the prior housing bubble highs seen in the mid-2000s before the housing crash that occurred alongside the Financial Crisis of 2008/2009. If the peak was the summit of Mt. Everest, we’re still a long way from base camp. Click here to learn more about Bespoke’s premium stock market research service.


Bespoke’s Morning Lineup – 2/1/23 – Starting the Month on a Down Note
See what’s driving market performance around the world in today’s Morning Lineup. Bespoke’s Morning Lineup is the best way to start your trading day. Read it now by starting a two-week trial to Bespoke Premium. CLICK HERE to learn more and start your trial.
“Money is the MC-mansion in Sarasota that starts falling apart after 10 years. Power is the old stone building that stands for centuries.” – Frank Underwood, House of Cards

Below is a snippet of content from today’s Morning Lineup for Bespoke Premium members. Start a two-week trial to Bespoke Premium now to access the full report.
What a January that was! After closing out an already bad year on a down note, the Nasdaq stormed into 2023 rallying 10.7% in January. Never mind the fact that it’s still only 1% higher than where it was when it closed November, the strong start to the year has a lot of bulls newly emboldened, although there’s more than a small minority of investors saying they won’t get fooled again.
So how common is it to see the Nasdaq rally 10% or more in a month? Since 2000, there have been 33 prior months where the Nasdaq rallied at least 10%, and if you narrow that down to 10% monthly rallies that followed a twelve-month period where the index was down, the list gets cut in half to just 16 prior occurrences. In the table below, we list each of those prior months since 2000 along with the Nasdaq’s forward performance over the next one, three, and twelve months. Since 2002, these 10%+ rallies after a decline in the prior twelve months have been followed by positive returns in the next year. During the year 2001, though, there were four separate occurrences, and each one was followed by declines over the next year. For a longer-term and more detailed look at the Nasdaq’s performance after 10+ monthly gains, check out today’s Morning Lineup.

Our Morning Lineup keeps readers on top of earnings data, economic news, global headlines, and market internals. We’re biased (of course!), but we think it’s the best and most helpful pre-market report in existence!
Start a two-week trial to Bespoke Premium to read today’s full Morning Lineup.
January 2023 Asset Class and Stock/Sector Performance
It was a January to remember for investors (who went through one of the worst years in recent history in 2022). Below is a look at the recent performance of various asset classes using our ETF matrix. Performance in January (YTD 2023), over the last six months, and over the last year is shown for each ETF (or exchange traded product).
Looking specifically at January, the Nasdaq 100 (QQQ) was the best performing US index ETF with a gain of 10.6%. The small-cap Russell 2,000 (IWM) wasn’t far behind with a gain of 9.8%. The Dow 30 (DIA) — the index that held up the best in 2022 — was up the least in January with a gain of 2.95%.
At the sector level, Communication Services (XLC) was up the most with a gain of 15.1% followed closely by Consumer Discretionary (XLY) at 14.8%. While these two sectors were up double-digit percentage points, three sectors actually fell in January: Consumer Staples (XLP), Health Care (XLV), and Utilities (XLU).
Outside of the US, the bulls were running with a number of country ETFs up 10%+, including Australia (EWA), China (ASHR), France (EWQ), Germany (EWG), Italy (EWI), Mexico (EWW), and Spain (EWP). India (PIN) was the only country in our matrix that was down with a decline of just 5 basis points.
Commodity ETFs/ETNs were mostly flat with one exception — natural gas. As shown, UNG was down 33.9% in January, and it’s now down 67.4% over the last six months.
Finally, Treasury ETFs continued to bounce back after a horrific 2022, with the longer the duration, the better the performance. The 20+ year Treasury ETF (TLT) was up the most with a huge monthly gain of more than 7%.

Below is a look at the average performance of stocks in the large-cap Russell 1,000 by sector during this past January. We also show the average distance from 52-week high and the average total return in 2022. As you can see, the areas that got hit the hardest in 2022 are the ones that bounced back the most in January. The average stock in the Communication Services sector gained 16% in January, but these stocks are still 32% below their 52-week highs after falling 32.6% in 2022. Energy and Utilities stocks averaged minimal gains in January, but they’re also the only two sectors that averaged gains in 2022.

Finally, below is a list of the 35 best-performing individual stocks in the Russell 1,000 in January. Topping the list is Carvana (CVNA) — which is still in the Russell 1,000 for now — with a gain of 114.6% during the month. Even after more than doubling in January, CVNA remains 94% below its 52-week high.
Aside from National Instruments (NATI), this list of big winners in January is a who’s who of stocks that got crushed in 2022. Not one stock was up last year, and they were down an average of 61.6% in 2022! After averaging a gain of 49.6% this month, they’re still close to 50% below their 52-week highs. The two biggest stocks on the list are Tesla (TSLA) and NVIDIA (NVDA). Tesla ended up gaining 40.6% in January after falling 65% in 2022, while NVIDIA gained 33.7% after getting cut in half in 2022. Some other recognizable names include Lucid (LCID), Peloton (PTON), Warner Bros Discovery (WBD), Lyft (LYFT), Spotify (SPOT), Roku (ROKU), Zillow (ZG), Paramount (PARA), and Carnival (CCL).

On the flip side, below are the 35 worst-performing stocks in the Russell 1,000 in January. Whereas the best-performing stocks this month were the ones that got hit hardest last year, the worst-performing stocks this month were mostly names that actually posted gains in 2022. On average, these 35 stocks fell 8.5% this month, but they were up 11.4% last year and are only 24% from 52-week highs. The three worst-performing stocks in January were Northrop Grumman (NOC), Enphase Energy (ENPH), and Texas Pacific (TPL). All three were up huge last year, with NOC up 43%, ENPH up 44.8%, and TPL up 91.2%. Click here to learn more about Bespoke’s premium stock market research service.

As always, past performance is no guarantee of future results.
Sector Divergence
On this last trading day of January, below is a snapshot of how the major US sector ETFs have performed so far this year. Over these last few weeks as the broad market has rallied, we’ve definitely seen some sector divergence. Defensive sectors like Consumer Staples (XLP) and Utilities (XLU) have come under selling pressure, while cyclical sectors more tied to the business cycle have surged. Communication Services (XLC) and Consumer Discretionary (XLY) are both up more than 12% YTD already, while Technology (XLK), Materials (XLB), Real Estate (XLRE), and Financials (XLF) are up more than 5%. The only sectors down on the year are Consumer Staples, Utilities, and Health Care (XLV). At the moment, four sectors are overbought (more than one standard deviation above their 50-DMAs) versus three that are oversold (more than one standard deviation below their 50-DMAs). Click here to learn more about Bespoke’s premium stock market research service.

Below is a snapshot of price charts for six sector ETFs pulled from our Chart Scanner tool. These are the three sectors up the most YTD (XLC, XLRE, XLY) and down the most YTD (XLP, XLU, XLV).

As we get set to enter a new month, last week we published a report for subscribers looking at historical market seasonality in February and for the remainder of the year based on how the market performs in January. Does a positive January typically mean positive returns going forward or does it not matter? To find out the answer to this question and see everything else Bespoke is publishing for subscribers, sign up for a one-month trial to Bespoke All Access today.

Bespoke’s Morning Lineup — 1/30/23
See what’s driving market performance around the world in today’s Morning Lineup. Bespoke’s Morning Lineup is the best way to start your trading day. Read it now by starting a two-week trial to Bespoke Premium. CLICK HERE to learn more and start your trial.
“There is no better teacher than history in determining the future. There are billion-dollar answers in $30 history books.” – Charlie Munger
Below is a snippet of content from today’s Morning Lineup for Bespoke Premium members. Start a two-week trial to Bespoke Premium now to access the full report.
With just two more trading days left in the month, below is a chart we published in our Chart of the Day from last Tuesday looking at rest-of-year performance when January has been a positive or negative month. Remember, since WW2, the rest of the year has generally been stronger when January has been an up month versus a down month. As shown, the S&P has averaged a decline of 0.27% across all Februarys, but the index has averaged a gain of 0.37% in February when January has been up versus a decline of 1.21% in February when January has been down. The trend is the same when looking at the rest of the first half and the rest of the year.

Drilling down further, there have only been two other instances since WW2 where the S&P gained more than 5% in January after posting a double-digit percentage decline in the prior year: 1967 and 1975. See how things turned out in those years by reading today’s full Morning Lineup.
Our Morning Lineup keeps readers on top of earnings data, economic news, global headlines, and market internals. We’re biased (of course!), but we think it’s the best and most helpful pre-market report in existence!
Start a two-week trial to Bespoke Premium to read today’s full Morning Lineup.
Bespoke Brunch Reads: 1/27/23
Welcome to Bespoke Brunch Reads — a linkfest of the favorite things we read over the past week. The links are mostly economy/market related, but there are some other interesting subjects covered as well. We hope you enjoy the food for thought as a supplement to the research we provide you during the week.
While you’re here, join Bespoke Premium with a 30-day trial!
Economy
Big Tech Is Really Bad at Firing People by Chris Stokel-Walker (Wired)
Thousands of tech workers have been laid off over the last few weeks, and they aren’t happy with the way their firings have been handled. [Link]
Corporate Layoffs Spread Beyond High-Growth Tech Giants by Chip Cutter and Theo Francis
It’s not just high-growth tech companies laying off workers, companies like IBM and Dow have also started to announce layoffs. There’s always dog walking. [Link]
How These Dog Walkers Make Over $100,000 a Year by Alyson Krueger (NYT)
Charging upwards of $35 per walk (more than the hourly rate for babysitters), some dog walkers in New York are making six-figure salaries. [Link]
You Quit Your Job, but You’re Still Miserable. Now What? By Eilene Zimmerman (NYT)
Overworked Americans who have quit their jobs have found that the absence of work and structure leaves them unmotivated and unable to move forward. [Link]
CVS, Walmart to Cut Pharmacy Hours as Staffing Squeeze Continues by Sharon Terlep and Sarah Nassauer (WSJ)
Both chains will curtail the operating hours of their pharmacies citing a lack of available pharmacists. Pharmacists were already in short supply before the pandemic, and consumer demand for Covid-19 shots and tests put additional strains on pharmacy operations. [Link]
Chase Locking Up Some ATMs at 5 P.M. Due to NYC Crime by Luke Funk (Fox5NY)
Citing higher crime risk at night and increased vagrancy, the bank will curtail the availability of 24-hour ATMs. [Link]
Smartphone Shipments Suffer the Largest-Ever Decline with 18.3% Drop in the Holiday Quarter by IDC
The drop marks the largest-ever decline in a single quarter and contributed to a steep 11.3% decline for the year. [Link]
Americans Fall Behind on Car Payments at Higher Rate Than in 2009 by Claire Ballentine (Bloomberg)
Higher interest rates and depleted savings have resulted in car repossessions surging to the highest rate since 2009. [Link]
Science
Earth’s Inner Core May Be Reversing Its Rotation, Study Finds by Eric Niier (WSJ)
Researchers believe the Earth’s inner core has reversed its rotation after they analyzed earthquake-driven seismic waves as they pass through the Earth. The result is that the length of a day has been shaved by fractions of a millisecond [Link]
The Food Expiration Dates You Should Actually Follow by J. Kenji López-Alt (NYT)
Believe it or not, most of those expiration dates are meaningless. “Vinegars, honey, vanilla or other extracts, sugar, salt, corn syrup, and molasses will last virtually forever,” and even eggs last much longer than their sell-by dates. [Link]
Humanity May Reach Singularity Within Just 7 Years, Trend Shows by Darren Orf (Popular Mechanics)
“On average, it takes a human translator roughly one second to edit each word of another human translator, according to Translated. In 2015, it took professional editors approximately 3.5 seconds per word to check a machine-translated (MT) suggestion — today that number is just 2 seconds. If the trend continues, Translated’s AI will be as good as a human-produced translation by the end of the decade (or even sooner).” [Link]
ChatGPT Is Coming for Classrooms. Don’t Panic by Pia Ceres (Wired)
ChatGPT has caused fears of rampant cheating in American education, but many educators say that the potential disruption is just what the US educational system needs. [Link]
Google, Not OpenAI, Has the Most to Gain From Generative AI by Mark Sullivan (Fast Company)
Alphabet has been criticized for ‘missing the boat’ on AI, but this article reminds readers that the company has been calling itself “AI-First” since 2017 and has invested heavily in the space. [Link]
Meta Embraces AI as Facebook, Instagram Help Drive a Rebound by Jeff Horwitz and Salvador Rodriguez (WSJ)
Fueled by heavy investment in AI, Meta is starting to see a path to recovery after the toughest year in the company’s history [Link]
Sports
MSG Owner James Dolan Threatens Alcohol Ban at MSG Over Facial Recognition Controversy by Fox 5 Staff (Fox5NY)
Madison Square Garden owner James Dolan has banned lawyers who are suing any of his companies from entering the Garden. The New York State Alcohol board has threatened to pull the Garden’s liquor license, so Dolan has suggested he may stop serving beer at one Rangers game and tell anyone who is upset about it to call the head of the state authority. [Link]
Quality Control Fiasco: George Brett Autograph Ends up on a Babe Ruth Baseball Card by Tyson Shushkevich (Just Baseball)
Can you imagine pulling an autographed Babe Ruth but then realizing that the actual signature was George Brett? You’d be mad. Think George Brett pine tar too high mad. [Link]
Ranking the top five Royal Rumble winners in WWE history: Is Steve Austin or Ric Flair No. 1? By Daniel Yanofsky (Sporting News)
With this weekend’s Royal Rumble, check out this list of the top five Royal Rumble Winners. Who will win the right to face Roman Reigns at WrestleMania 39? Will The Rock make a comeback? [Link]
Read Bespoke’s most actionable market research by joining Bespoke Premium today! Get started here.
Have a great weekend!
Bad Gas
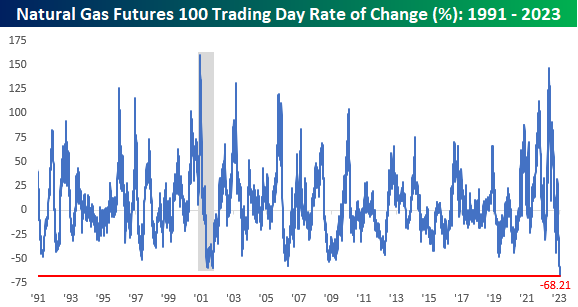
If you think the clobbering of growth stocks in 2022 was harsh, check out the performance of natural gas. Towards the end of last summer when there were real worries that many Europeans were going to freeze to death in the winter cold without gas to heat their homes, the price of natural gas in the US traded to the highest levels in over a decade and approached double-digits. As steep as the runup last year was, the downfall has been even steeper. Suffice it to say, the price of the front month futures contract is nowhere near $10 anymore, and just this week dropped below $3 to its lowest level in more than a year. More recently, the slide has been pretty relentless with 14 declines over the last 20 trading days.

The chart below shows the 100-trading day rate of change in natural gas futures going back to 1991. Through Thursday’s close, the price of the front month contract was down by more than two-thirds (68.21%), which, believe it or not, is the steepest drop over a 100-trading day period in the history of the futures contract (since 1991). It’s interesting to note that the current decline comes just eight months after what was the second-strongest 100-trading day rally in the history of the futures contract (+147%). The strongest 100-day rally was all the way back in December 2000 when prices surged 160%. Like the rally last May, that strong rally was followed eight months later by what is now the second-largest 100-day decline in natural gas prices.
The lesson here may be that if natural gas rallies 100% in 100 days, you probably want to avoid it. In the eight prior periods when the commodity rallied 100% in 100 days, its median performance over the following year was a decline of 30.1% with declines 75% of the time. Conversely, the performance of natural gas following 50%+ declines in 100 days hasn’t been as consistent. In the five prior periods that fit that criteria, natural gas was up by a median of just 1.4% with gains three out of five times. Click here to learn more about Bespoke’s premium stock market research service.
Bespoke’s Morning Lineup — 1/27/23
See what’s driving market performance around the world in today’s Morning Lineup. Bespoke’s Morning Lineup is the best way to start your trading day. Read it now by starting a two-week trial to Bespoke Premium. CLICK HERE to learn more and start your trial.
“If it doesn’t matter who wins or loses, then why do they keep score?” — Vince Lombardi
Below is a snippet of content from today’s Morning Lineup for Bespoke Premium members. Start a two-week trial to Bespoke Premium now to access the full report.
It’s conference championship weekend for the NFL as the Bengals travel to Kansas City in the AFC and the 49ers travel to Philadelphia in the NFC. The AFC championship game is an exact repeat of last year’s match-up when the Bengals upset the Chiefs on the road. We’ve only seen the same two teams play in the same location in the AFC Championship game in back-to-back years two prior times, once in 2011/2012 (Ravens at Patriots) and once in 1978/1979 (Oilers at Steelers).
If you’re looking for more individual stock ideas, yesterday we updated our Bespoke 50 list of noteworthy Russell 3,000 growth stocks. We like this list as an idea generator for further research into the 50 names that make the cut each week.
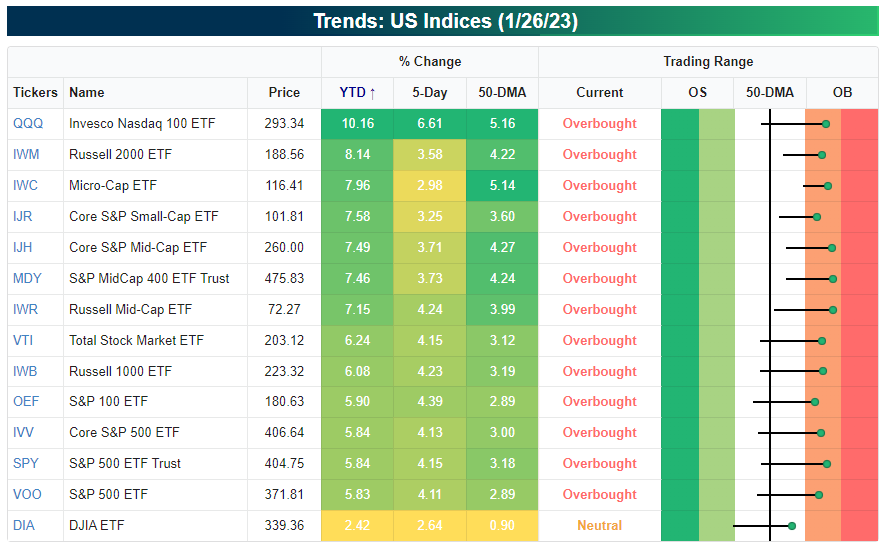
At the index level, take a look below at our Trend Analyzer snapshot of major US index ETFs. It’s green across the board when it comes to 50-DMA spread, 5-day change, and YTD change. The Nasdaq 100 (QQQ) is in the lead on a YTD basis with a gain of 10.1%, and it’s also up the most over the last five days and the farthest above its 50-DMA. This is the opposite of what we saw in 2022 when QQQ lagged the rest of the market severely. As you can see, every single index ETF on the list is now “overbought” with the exception of the Dow 30 (DIA).
Our Morning Lineup keeps readers on top of earnings data, economic news, global headlines, and market internals. We’re biased (of course!), but we think it’s the best and most helpful pre-market report in existence!
Start a two-week trial to Bespoke Premium to read today’s full Morning Lineup.