May 14, 2026
See what’s driving market performance around the world in today’s Morning Lineup. Bespoke’s Morning Lineup is the best way to start your trading day. Read it now by starting a two-week trial to Bespoke Premium. CLICK HERE to learn more and start your trial.
“Chinese restaurants in America today outnumber the five largest fast food chains in the US all combined.” – Donald Trump

Below is a snippet of commentary from today’s Morning Lineup. Start a two-week trial to Bespoke Premium to view the full report.
US futures are in rally mode this morning as strong earnings from Cisco (CSCO) push that stock to record highs. The S&P 500 is on pace to open higher by about 0.3% while the Nasdaq is up 0.2%. Dow futures are leading the way, gaining 0.81%, which would put the index back above 50,000. The picture for US markets is positive now, but there’s a busy schedule of economic data on the calendar, kicking off with jobless claims and Retail Sales at 8:30.
Treasury yields are pulling back a bit with the 10-year yield down 4 bps to 4.44%. Oil prices are modestly lower, but WTI remains above $100. There have been no major developments out of the Middle East. Both gold and Bitcoin are little changed.
Asian markets were mixed overnight, with Japan down 1%, while Chinese stocks fell 1.5%. South Korea, meanwhile, bucked the trend, rallying 1.8%. The meetings between Trump and Xi and their entourages are obviously the major story of the day, and investors will be looking for any headlines coming from those meetings. In Europe, equities are higher across the board with the STOXX 600 up 0.6%, led higher by a 1.5% rally in Germany.
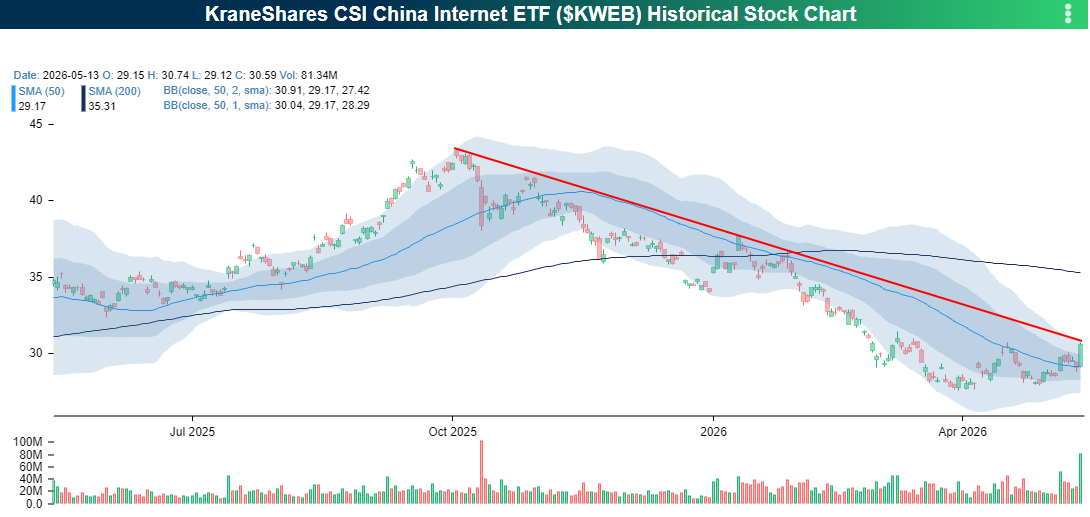
With all the attention shifting to China over the last 24 hours, investors rotated into Chinese stocks yesterday as the KraneShares China Internet ETF (KWEB) rallied just under 5% on strong volume for its best day since late January. Despite the rally, the stock finished yesterday’s session just below the downtrend line that has been in place since last October. KWEB has clearly stabilized since early April following steady losses over the preceding six months, but for bulls to get excited, they’ll need to see that downtrend get broken.
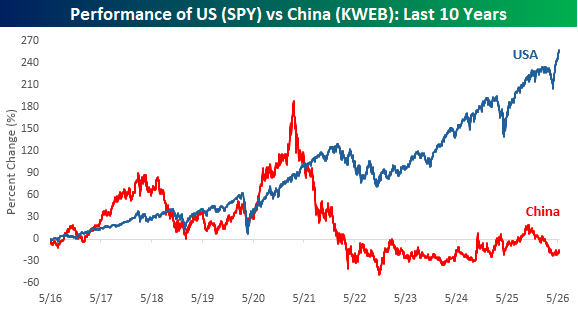
Chinese tech and US stocks have followed interesting paths over the last decade. While the performance was a close race between the world’s two superpowers in the last half of the last decade, in the post-Covid era, the two ETFs have followed diverging paths. Five years ago, the performance of KWEB and SPY in the prior five years was nearly identical. Since then, they have moved completely in opposite directions. As a result, the trailing 10-year performance of SPY is a gain of over 250% compared to a decline of 15% for KWEB! You can debate all you want about which world leader has the upper hand on a diplomatic basis heading into this summit, but from a market perspective, Trump is holding the nuts.
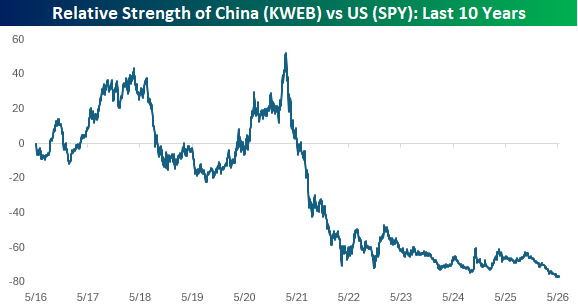
The relative strength of KWEB versus SPY further illustrates the sharp contrast. Chinese tech stocks fell off a cliff (almost literally) in the second half of 2021 and haven’t recovered since. Just in the last two weeks, the relative strength of KWEB versus SPY hit a record low.
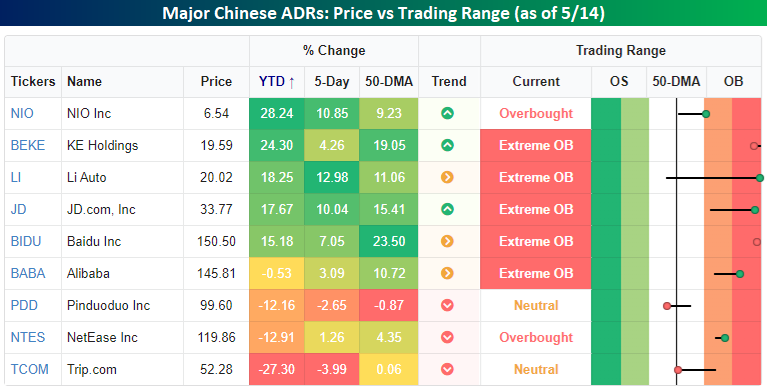
At the individual stock/ADR level, Chinese stocks have experienced mixed returns this year. The snapshot below from our Trend Analyzer shows where nine of the largest/most active Chinese ADRs are trading relative to their trading ranges. YTD, some of these ETFs have seen big gains while others are down double-digits.
On a short-term basis, practically all these ADRs are doing well, as Pinduoduo (PDD) is the only one trading below its 50-DMA, while Trip.com (TCOM) is the only other ETF on the list that is not currently at overbought levels.
Start a two-week trial to Bespoke Premium to continue reading today’s full Morning Lineup.
May 13, 2026
See what’s driving market performance around the world in today’s Morning Lineup. Bespoke’s Morning Lineup is the best way to start your trading day. Read it now by starting a two-week trial to Bespoke Premium. CLICK HERE to learn more and start your trial.
“We should keep on going along the path of globalization. Globalization is good… when trade stops, war comes.” – Jack Ma
Below is a snippet of commentary from today’s Morning Lineup. Start a two-week trial to Bespoke Premium to view the full report.
Paul Hickey appeared on CNBC’s Squawk on the Street on Tuesday to discuss markets, semis, and inflation. To view the segment, click on the image below.
It’s hard to call yesterday’s decline (-0.16% in the S&P 500 and -0.71% in the Nasdaq) a dip, but investors have stepped in to buy it this morning as both the S&P 500 and Nasdaq are poised to erase yesterday’s losses at the open. Treasury yields are little changed, crude oil is fractionally lower, gold is higher, and Bitcoin is modestly lower but still above $80K.
The positive tone in US futures follows an up night in Asia as the Nikkei rallied 0.8% and South Korea jumped 2.6%. Chinese stocks are up 0.7% as Air Force One is touching down in Beijing as we type this.
In Europe, the tone is mixed with the STOXX 600 up 0.3% as Germany leads (+0.6%) and France and Spain decline fractionally. GDP in the Eurozone increased 0.1%, which was inline with expectations, while employment increased slightly more than expected, although French unemployment unexpectedly increased from 7.9% up to 8.1%.
The only economic report on the calendar this morning was April PPI, and boy, was it a clunker. Headline PPI surged 1.4% – not y/y but m/m while the core reading surged 1.0% versus estimates for an increase of just 0.3%. The headline index was only forecast to increase 0.5%. PPI tends to be more volatile than CPI, but these numbers are hot, hot, hot. As you would expect, the immediate response in the futures market was for yields to spike higher while equities erased half of their pre-release gains.
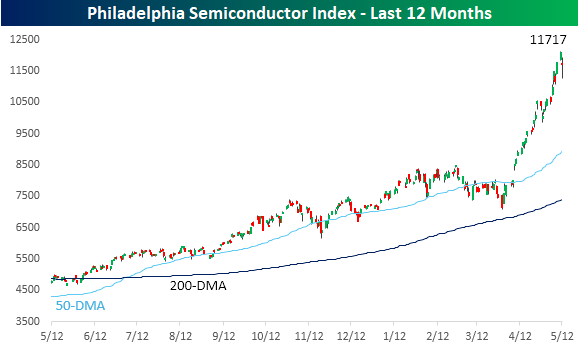
It was bound to happen at some point. After seemingly going up every day lately, the Philadelphia Semiconductor Index (SOX) declined just over 3% yesterday after falling as much as 6.7% on an intraday basis. Even for semis, swings and declines of that magnitude are notable, but looking at the chart, you can barely see them. Even after that drop, the SOX is still 31% above its 50-day moving average.
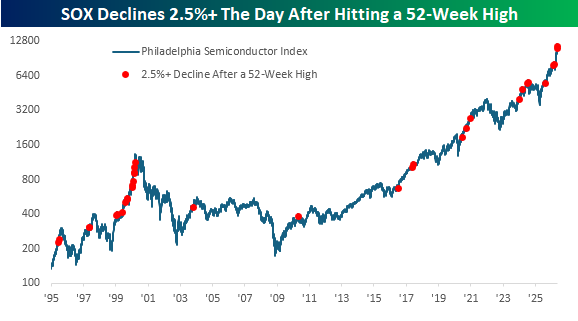
We were curious to see how common it is for the SOX to fall more than 2.5% just one day after closing at an all-time high. Since 1995, it’s happened 23 other times. You know when the last occurrence was? Last Thursday! It was also the fourth occurrence this year.
The chart below shows each prior occurrence with a red dot. While there were certainly other occurrences spread sporadically over the years, the only other time they were as frequent as the last five years were during the mid-1990s, right up to the 2000 peak. That’s a parallel that has come up a lot lately, with the trillion-dollar question being where we are in that comparison – 1998 or early 2000.
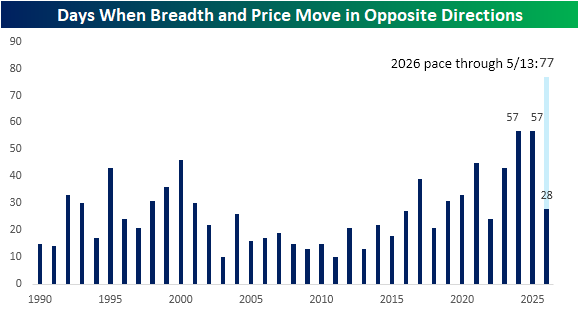
We’ve discussed the lack of strong market breadth on up days several times in recent weeks, but yesterday we saw the opposite as the S&P 500 declined even as its net advance/decline line was positive. That divergence marked the third straight day and the 28th time this year that price and breadth moved in opposite directions.
The chart below shows the frequency of days by year when price and breadth diverged. Over the last ten years, we’ve seen a steady increase in the number of occurrences, and in both 2024 and 2025, the S&P 500 saw a record number of divergent days. As mentioned above, we’ve already seen 28 occurrences this year. If that pace continues, this year’s total would spike up to 77, far eclipsing the records of the prior two years.
Start a two-week trial to Bespoke Premium to continue reading today’s full Morning Lineup.
May 12, 2026
See what’s driving market performance around the world in today’s Morning Lineup. Bespoke’s Morning Lineup is the best way to start your trading day. Read it now by starting a two-week trial to Bespoke Premium. CLICK HERE to learn more and start your trial.
“And so castles made of sand fall into the sea, eventually.” – Jimi Hendrix
Below is a snippet of commentary from today’s Morning Lineup. Start a two-week trial to Bespoke Premium to view the full report.
As prospects for a peace deal in Iran dwindle, traders are reducing risk as crude oil prices push higher and equity futures decline. The S&P 500 is on pace to open down 0.34%, while the Nasdaq is down more than twice that 0.71% as the hottest area of the markets experiences the most profit-taking. Crude oil prices are up over 4% as WTI trades back above $100 and Brent pushes towards $108. Gold prices are down about 0.5%, and Bitcoin is down 1.7% but still above $80K.
Lower odds of a peace deal have a more negative impact on Europe, and the STOXX 600 is down 0.70%, with Germany down over 1%. In Asia, the picture was mixed. The Nikkei rallied 0.5%, but Hong Kong, China, and South Korea all traded lower, with the latter falling the most (-2.3%). The decline in South Korea followed a proposal from a policymaker suggesting the country should pay citizens a ‘dividend’ using taxes on profits from AI-related industries.
Small business sentiment was released earlier this morning, and while the headline index was weaker than expected, it showed a modest increase relative to last month. The big report of the day, though, will be April’s CPI at 8:30. Economists expect the headline index to increase 0.6% with the core reading expected to jump 0.3%. While the market expects sizable increases to both indices, we would note that there hasn’t been a report yet this year where headline or core CPI was higher than expected.
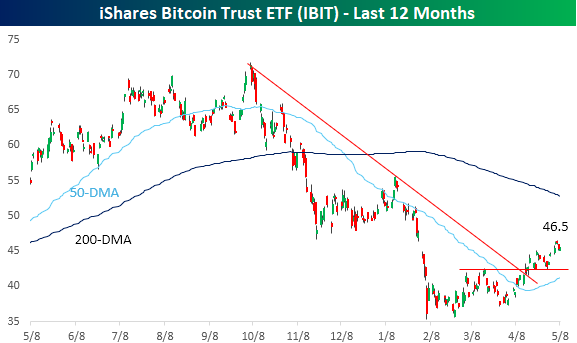
With everyone seemingly focused on Iran and semiconductors, Bitcoin has quietly carved out what increasingly looks like a bottom and the early stages of what could be an emerging uptrend. Since its intraday low in early February, the OG cryptocurrency has made a series of higher highs and higher lows. In early April, the price broke its downtrend from last year’s high, which also coincided with short-term resistance. Just to get back to even for the year, though, the Bitcoin ETF (IBIT) would need to rally more than 7% from yesterday’s close (8%+ from pre-market levels), and it’s still more than 35% below its 52-week high which would require a rally of 55% to get back to.
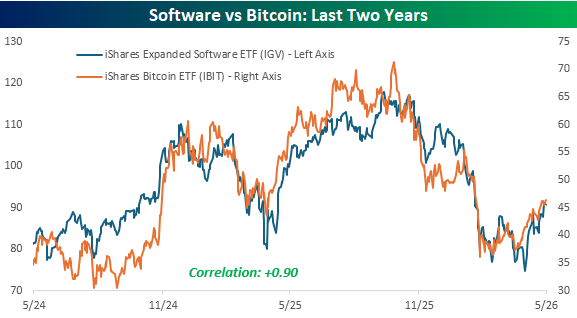
The direction of Bitcoin could be an important tell for one of the most beaten-down groups in the market, as the iShares Software ETF (IGV) has traded practically in lockstep with Bitcoin over the last two years. They’ve had their ups and downs, but IBIT and IGV have one of the closest relationships of any two major non-index ETFs, with a correlation of +0.90.
Start a two-week trial to Bespoke Premium to continue reading today’s full Morning Lineup.
May 11, 2026
See what’s driving market performance around the world in today’s Morning Lineup. Bespoke’s Morning Lineup is the best way to start your trading day. Read it now by starting a two-week trial to Bespoke Premium. CLICK HERE to learn more and start your trial.
“The toughest thing about success is that you’ve got to keep on being a success.” – Irving Berlin
Below is a snippet of commentary from today’s Morning Lineup. Start a two-week trial to Bespoke Premium to view the full report.
Futures point to a lackluster start to the new week as the S&P 500 and Nasdaq are both indicated to open the week 0.10% lower. Given the move higher in crude oil, though, it could be worse. WTI is trading up over 3% to more than $98 per barrel after the US rejected Iran’s latest peace proposal as a non-starter. The 10-year yield is nearly 3 bps higher but still under 4.4%, while gold is down over 1%, and Bitcoin is fractionally higher.
Overnight in Asia and Europe this morning, it’s been a negative start to the week on the Iran news, but in the US, attention will likely shift from the Middle East to inflation – at least in the short term – with Tuesday’s release of CPI and Wednesday’s PPI.
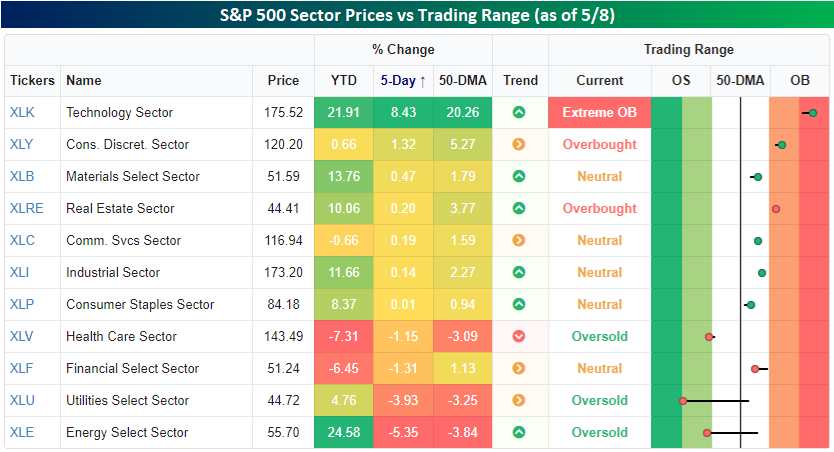
Every week is interesting, but last week’s breadth was a standout. The S&P 500 finished 2.33% higher, but mega caps did most of the heavy lifting as the average stock in the index finished the week higher by just 0.64%. Check out the snapshot below from our Trend Analyzer showing each sector’s performance and where they traded relative to their trading ranges. Again, while the S&P 500 was up over 2%, the only sector that outperformed the index was Technology, and with a gain of 8.43%, it outperformed by a lot! The only other sector that rallied more than 1%, though, was Consumer Discretionary (+1.32%), and no other sector even finished the week higher with a gain of 0.5%.
Not only did most sectors underperform last week, but more sectors were down 1% than up 1%. In fact, there were just as many sectors that finished down by over 3% – Energy and Utilities – as there were that finished up at least 1%!
Where each sector settled out the week relative to its trading range also varied widely. While Technology heads into the new week at ‘extreme’ overbought levels, Utilities is right on the cusp of ‘extreme’ oversold levels, and Energy and Health Care also finished the week at oversold levels.
However weak overall breadth was, a gain is a gain, and the S&P 500, Nasdaq, and Russell 2000 now all have winning streaks of at least six weeks. Six-week winning streaks aren’t that out of the ordinary for any of the three indices on their own, but for all three to have one simultaneously is much less common. Since the Russell 2000 started in 1979, there have only been ten other periods.
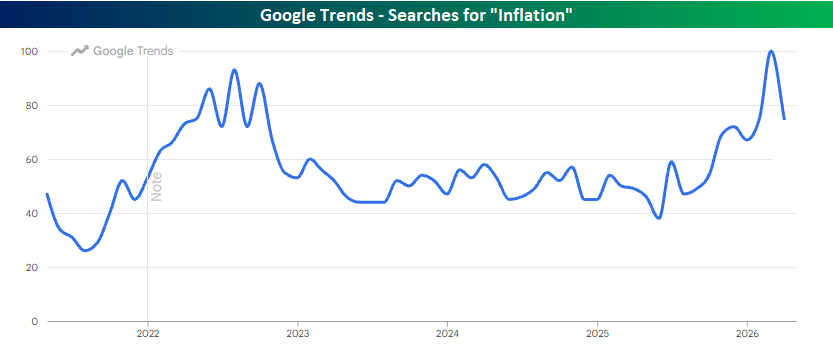
Finally, inflation will be a big topic this week with the release of CPI on Tuesday and PPI on Wednesday. Obviously, the market is expecting big upticks in inflation. What surprised us, though, is the uptick in search activity related to inflation. According to Google Trends, searches for “inflation” during March surpassed the peak levels seen during 2022 when CPI surged as high as 9.1% y/y. For tomorrow’s CPI, economists are only forecasting an increase to 3.7% from 3.4% in April.
Start a two-week trial to Bespoke Premium to continue reading today’s full Morning Lineup.
May 8, 2026
See what’s driving market performance around the world in today’s Morning Lineup. Bespoke’s Morning Lineup is the best way to start your trading day. Read it now by starting a two-week trial to Bespoke Premium. CLICK HERE to learn more and start your trial.
“There is nothing new in the world except the history you do not know.” – Harry Truman
Below is a snippet of commentary from today’s Morning Lineup. Start a two-week trial to Bespoke Premium to view the full report.
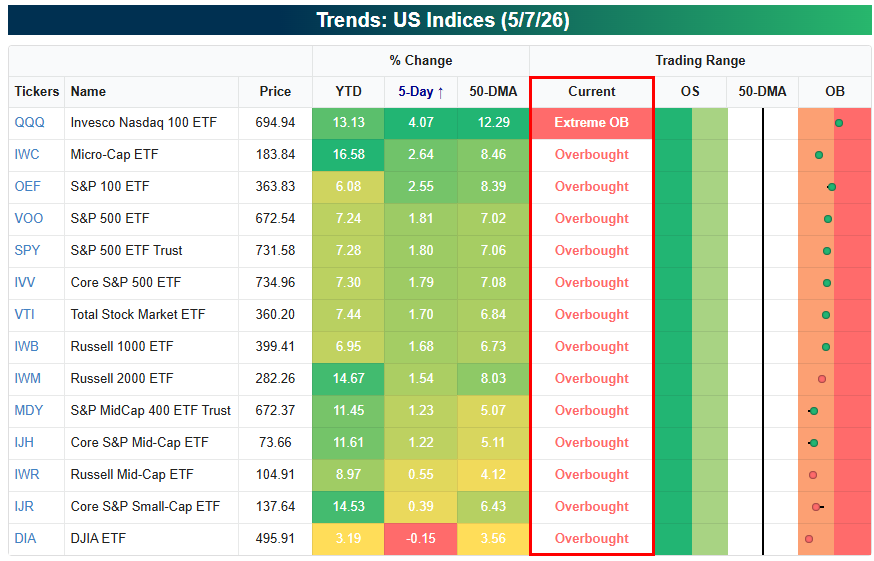
As shown below, we’re entering the last trading day of the week with all of key US index ETFs still in overbought territory:
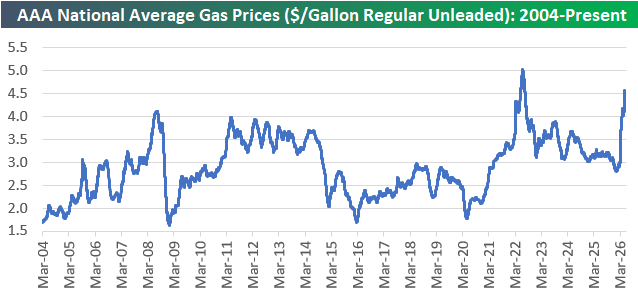
Gas prices continue to spike with the average price for a gallon of regular unleaded up to $4.55/gallon nationally. Ten days ago near the end of April, prices were at $4.17/gallon, so they’ve seen another meaningful pick-up recently.
Just before the Iran War, gas prices had fallen down into the $2s. Now they’re closer to $5/gallon than $4.
Start a two-week trial to Bespoke Premium to continue reading today’s full Morning Lineup.
May 7, 2026
See what’s driving market performance around the world in today’s Morning Lineup. Bespoke’s Morning Lineup is the best way to start your trading day. Read it now by starting a two-week trial to Bespoke Premium. CLICK HERE to learn more and start your trial.
“I shall seize Fate by the throat; it shall certainly not bend and crush me completely.” – Beethoven
Below is a snippet of commentary from today’s Morning Lineup. Start a two-week trial to Bespoke Premium to view the full report.
Today is the last super-busy day for earnings this season, so we’ll be providing a nice summary of all the results in tomorrow’s Bespoke Report newsletter.
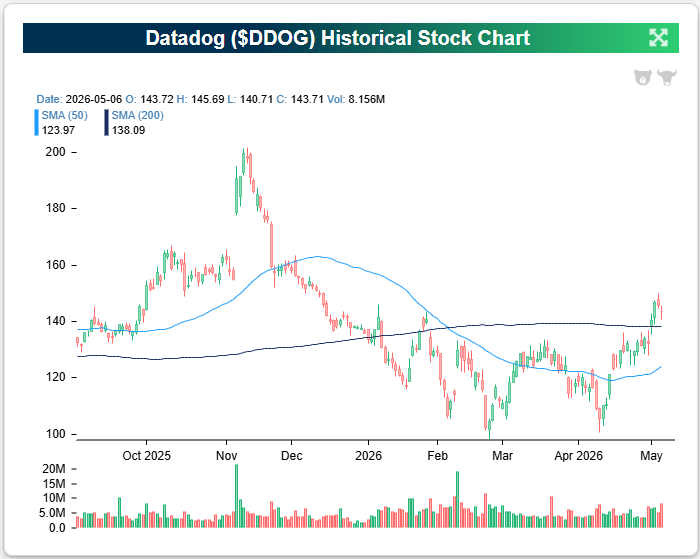
In Monday’s Chart of the Day, we pointed out that Datadog (DDOG) was reporting earnings Thursday morning with a 100% historical EPS and sales beat rate. As a member of the Software group, DDOG took it on the chin from November through March, but it has recovered nicely in the last two months and broken out of its downtrend in the process.
DDOG has historically been a triple play beast, and it delivered once again this morning with another beat on EPS and sales and raised guidance. Shares are up 22% pre-market. The pop highlights that not all “software” stocks are the same, and when names get “thrown out with the bathwater” – the AI Doom trade in this case – opportunities arise.
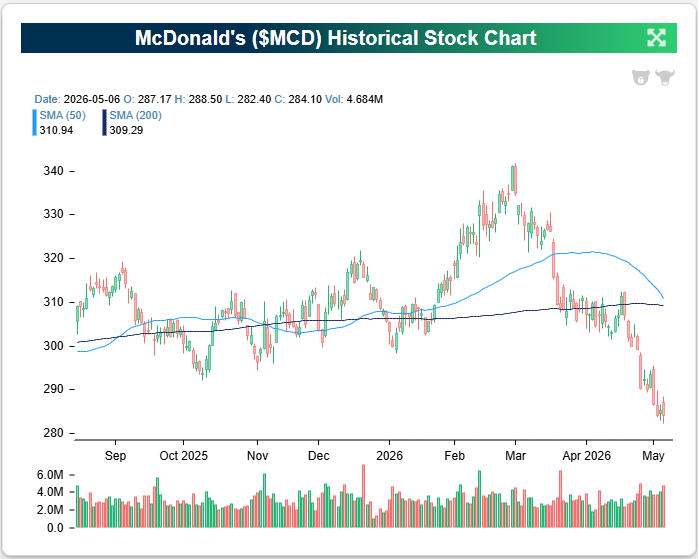
McDonald’s (MCD) is another name that reported this morning, and the company reported a nice EPS beat on roughly inline revenues. Same-store sales growth was up just under 4% in both domestic and international markets.
As shown below, MCD has had a rough run since the Iran War began as investors worried about both consumer demand and higher input costs. This morning’s earnings assuages some of those fears, and shares are up 3% pre-market.
Start a two-week trial to Bespoke Premium to continue reading today’s full Morning Lineup.