May 6, 2026
See what’s driving market performance around the world in today’s Morning Lineup. Bespoke’s Morning Lineup is the best way to start your trading day. Read it now by starting a two-week trial to Bespoke Premium. CLICK HERE to learn more and start your trial.
“Good judgment comes from experience, and a lot of that comes from bad judgment.” – Will Rogers

Below is a snippet of commentary from today’s Morning Lineup. Start a two-week trial to Bespoke Premium to view the full report.
US equity futures are up 1% this morning due to more gains from semis and a headline from Axios that the US and Iran are “closing in on a one-page memo to end the war.”
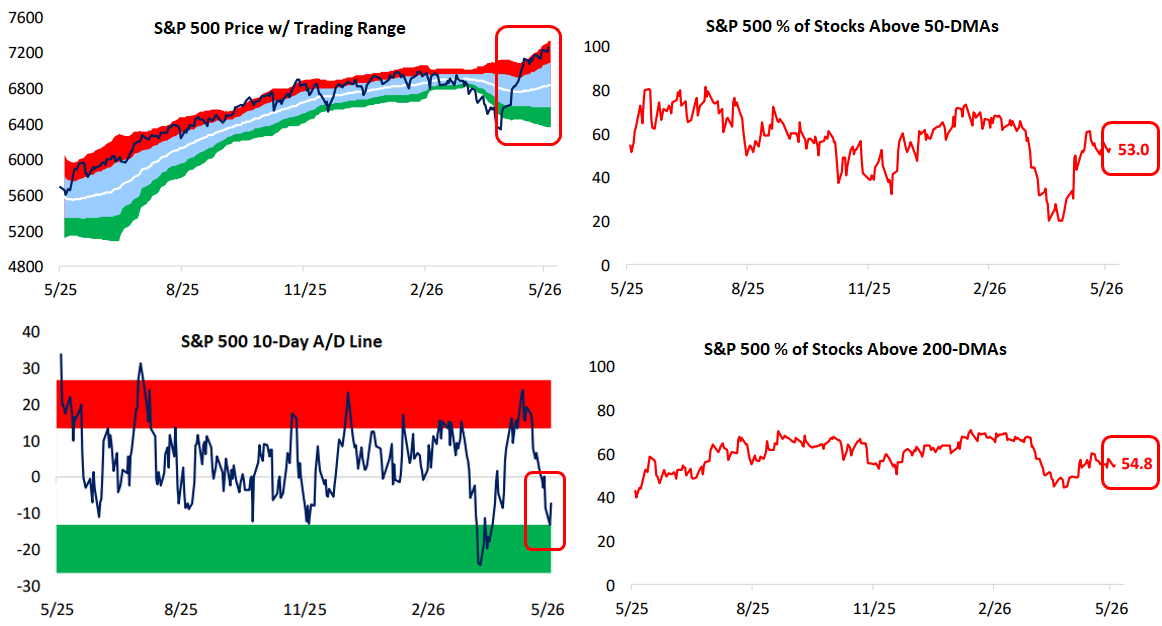
Notably, while the S&P 500’s price is still looking quite overbought, underlying breadth is neutral at best. As shown below, just over 50% of stocks in the S&P are above their 50-DMAs and 200-DMAs, and the S&P’s 10-day advance/decline line is still close to oversold territory.
So while price is extended to the upside, internals suggest that the rally still has room to run before we’d categorize it as overheated in the near term.
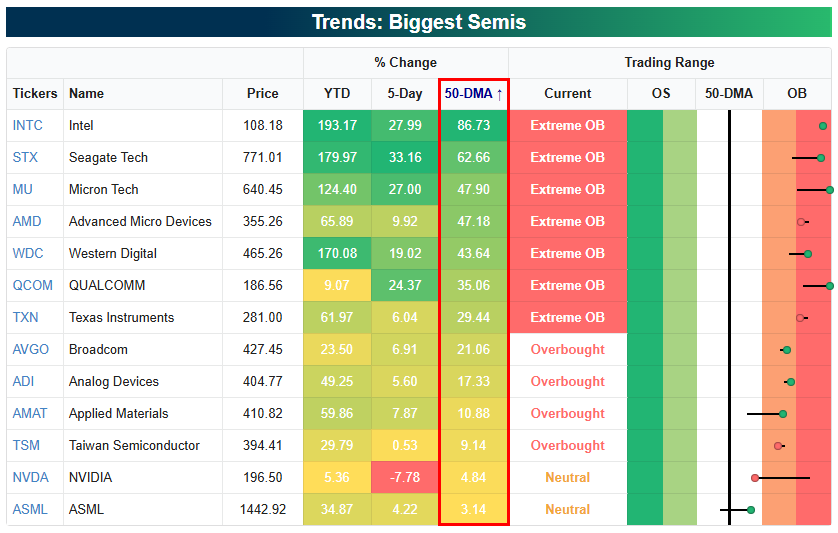
The semis are a different story, however. They’re currently experiencing one of the most epic runs in history, and the group is about as overbought as it gets.
As shown below, stocks like Intel (INTC), Seagate (STX), Micron (MU), and Advanced Micro (AMD) are up anywhere from 10-33% over the last week, and they’re set to open up sharply again this morning. When the opening bell rings, all four of these stocks will be more than 50% above their 50-DMAs.
Start a two-week trial to Bespoke Premium to continue reading today’s full Morning Lineup.
May 5, 2026
See what’s driving market performance around the world in today’s Morning Lineup. Bespoke’s Morning Lineup is the best way to start your trading day. Read it now by starting a two-week trial to Bespoke Premium. CLICK HERE to learn more and start your trial.
“If you don’t use your experience, your past is wasted” – Alan Shepard
Below is a snippet of commentary from today’s Morning Lineup. Start a two-week trial to Bespoke Premium to view the full report.
Yields are behaving themselves this morning as the 10-year US Treasury yield is unchanged at around 4.44%, and near the highest levels since last summer.
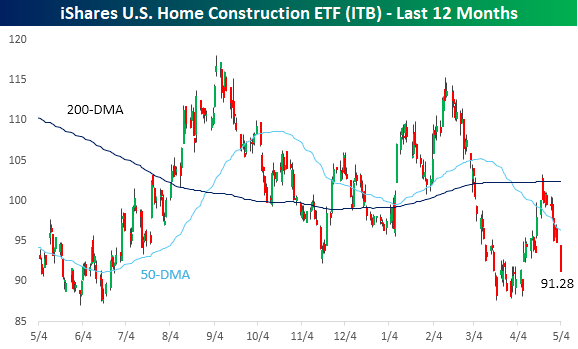
While rising yields haven’t had much of an impact on the overall equity market yet, the same can’t be said for homebuilders. In early February, the iShares US Home Construction ETF (ITB) was near 52-week highs and above $115. Yesterday, it closed at $91.28, or more than 20% below those levels from two months ago. While the S&P 500 is up over 13% from its March lows, ITB has only rallied 3%.
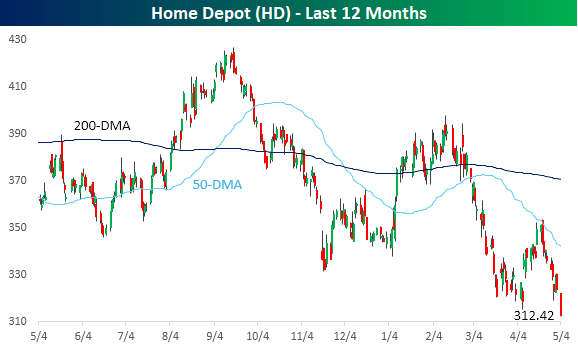
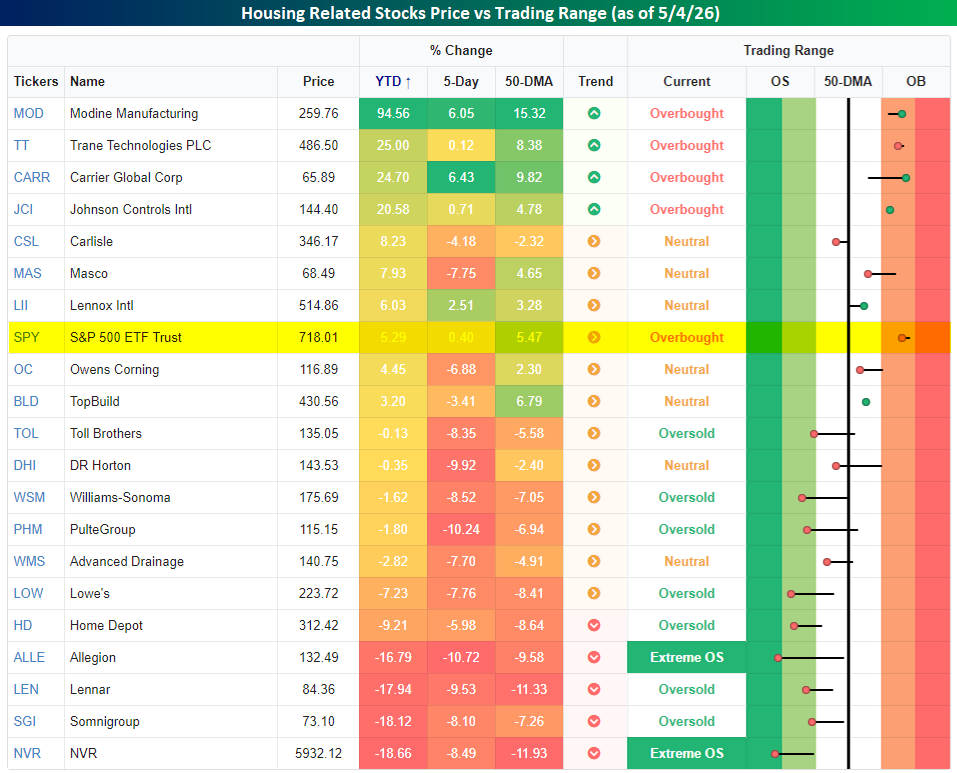
Rising yields have been more painful for housing-related stocks. Home Depot (HD) is a perfect example. Yesterday, the world’s largest home improvement retailer closed at a 52-week low of $312.42. The stock is down over 20% from its February high and over 26% from its 52-week high.
Looking more broadly at housing-related stocks. The snapshot below from our Trend Analyzer shows the 20 largest components in the SPDR S&P Homebuilders ETF (XHB), and the majority are not only underperforming the S&P 500 on a YTD basis, but they’re also down. The last week has been especially painful for the group, as all but six of them are down just as yields have started to spike.
There are some bright spots in terms of performance this year. Stocks like Modine Manufacturing (MOD), Trane Technologies (TT), Carrier Global (CARR), and Johnson Controls (JCI) are all up over 20% YTD, and they’re the only overbought stocks on the list. The rally in these four stocks really has nothing to do with housing, though. They’re all rallying due to the massive demand for cooling in AI data centers.
Turning to the markets this morning, futures are higher with the S&P 500 indicated to open up 0.4% and the Nasdaq rallies 0.6%. As mentioned above, yields have been behaved with the 10-year right around yesterday’s close of 4.44%. Oil prices are giving back some of yesterday’s gains, falling over 2% to just under $104 per barrel in WTI. Lastly, gold prices are up about 1%, while Bitcoin is up over 1% and back above $81K.
In Asia overnight, Japan, China, and South Korea were closed, while Hong Kong dropped 0.8%. In Europe, markets are all open and generally higher. The STOXX 600 is up 0.5%, led higher by Spain (1.35%) and Germany (1.0%). The UK is the main laggard, falling 1.3%.
In the US today, we’ll get service sector PMIs from S&P and ISM, along with New Home Sales and JOLTS.
Start a two-week trial to Bespoke Premium to continue reading today’s full Morning Lineup.
May 4, 2026
See what’s driving market performance around the world in today’s Morning Lineup. Bespoke’s Morning Lineup is the best way to start your trading day. Read it now by starting a two-week trial to Bespoke Premium. CLICK HERE to learn more and start your trial.
“Nothing is impossible, the word itself says ‘I’m possible’!” – Audrey Hepburn
Below is a snippet of commentary from today’s Morning Lineup. Start a two-week trial to Bespoke Premium to view the full report.
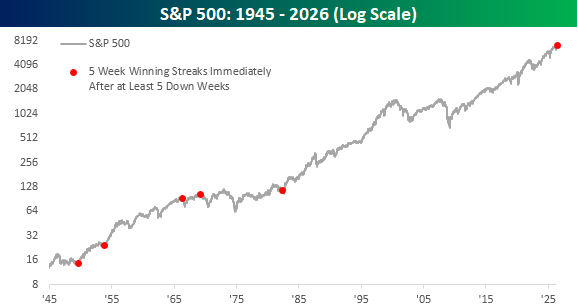
16-year-old, meet market. If you think the life of a 16-year-old is an emotional roller-coaster where ‘life isn’t fair’ turns into ‘top of the world’ on a dime, the market has been doing a stellar impression lately. From the end of February right through all of March, the S&P 500 declined for five straight weeks. Once March ended, though, the pendulum swung completely in the opposite direction with five straight weeks of gains. There hasn’t been any in between.
It has been very uncommon for the S&P 500 to experience at least five weekly declines followed by at least five weekly gains. Since WWII, there have been 32 other losing streaks of at least five weeks, and there have been 120 streaks of at least five-week gains. However, there have only been five other periods when a five-week winning streak came immediately after a streak of at least five weeks of losses. The last one was way back in 1982, so the teenagers out there (and maybe even their parents) won’t remember that one.
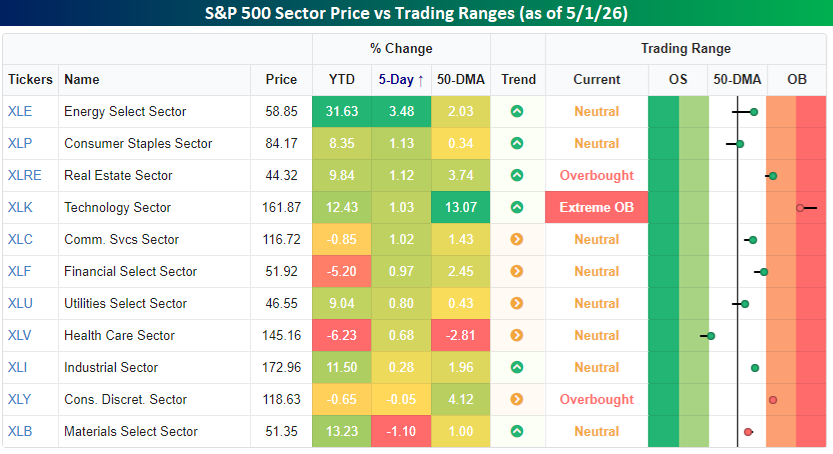
Last week also saw a notable shift in a pattern that has been prevalent ever since the war started. For the last nine weeks, it seemed as though whatever was good for oil prices and the energy sector was bad for all other stocks and vice versa. Last week, though, Energy was the top-performing sector, gaining 3.48%, but the only other stocks to finish the week lower were Materials (-1.10%) and Consumer Discretionary (-0.05%). In fact, four other sectors rallied more than 1%, including Technology (1.03%) and Communication Services (1.02%). The market won’t be able to ignore rising energy prices in perpetuity, but it is a welcome respite.
It’s been a volatile morning for equity futures as conflicting headlines from the Middle East caused a sharp pullback in futures earlier this morning. Reports that Iran fired on a US ship erased earlier gains in equities and a sharp increase in oil prices. US officials have refuted the reports, though, and we’ve reclaimed a decent amount of the earlier losses, and the S&P 500 is now just down 0.2% while the Nasdaq is flat.
In Asia, Japan and China were closed for a holiday, but South Korea surged over 5% while Hong Kong rallied 1.2%. Manufacturing PMIs for both South Korea and Singapore both expanded more than expected.
European stocks returned from last Friday’s holiday with losses. The STOXX 600 is down over 0.5%, led lower by Spain, which is down over 1% while France and Italy are both underperforming. Like Asia, Manufacturing PMIs for countries in the region have generally been stronger than expected.
Looking ahead to the US today, the only economic report on the calendar is Factory Orders at 10 AM. NY Fed President Williams will be speaking at the Yale Club just before 1 PM, and after the bell, Palantir (PLTR) will report Q1 earnings.
Start a two-week trial to Bespoke Premium to continue reading today’s full Morning Lineup.
May 1, 2026
See what’s driving market performance around the world in today’s Morning Lineup. Bespoke’s Morning Lineup is the best way to start your trading day. Read it now by starting a two-week trial to Bespoke Premium. CLICK HERE to learn more and start your trial.
“If The Headline Is Big Enough, It Makes The News Big Enough.” – Citizen Kane
Below is a snippet of commentary from today’s Morning Lineup. Start a two-week trial to Bespoke Premium to view the full report.
Equity futures are slightly higher this morning as investors look to breathe a sigh of relief after a wild couple of weeks. Besides the massive gains in April, the massive deluge of earnings reports this week in terms of both quantity and market cap had the potential to create waves. But we got through it just about as well as you could ask for, as none of the major mega-caps blew up and Wednesday’s Fed meeting was a non-event despite all the pearl-clutching over the number of dissents regarding, not the policy decision, but the phrasing of forward guidance. The media needs something to talk about, though!
The bigger question is, with the most consequential earnings reports and Powell’s last meeting as Fed Chair behind us, what will be the next catalyst? Iran again? That may be the case, though, as just now reports are crossing the tape that Iran has sent a new proposal to Pakistan.
Treasury yields are slightly lower in the US this morning, with the 10-year yield at 4.38%, crude oil is slightly lower, gold is down nearly 1%, and Bitcoin is up 1.5%. International markets are mostly closed this morning in observance of the May Day holiday, but Japan and the UK were both open, and the former saw a modest gain while the UK is down about 0.6%
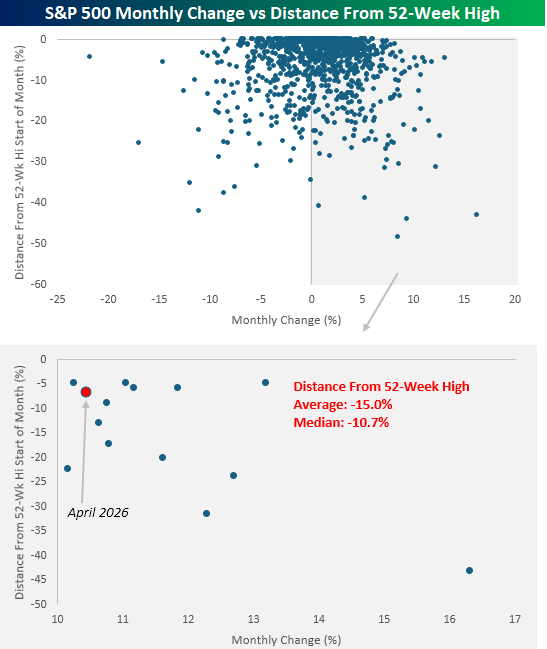
The S&P 500 rallied 10.43% in April, marking the largest monthly gain for the index since November 2020 and the 14th month since WWII that the S&P 500 had a monthly gain of more than 10%. While moves of this magnitude were rare in the immediate years after WWII, they have been somewhat more frequent, but still uncommon, in recent decades.
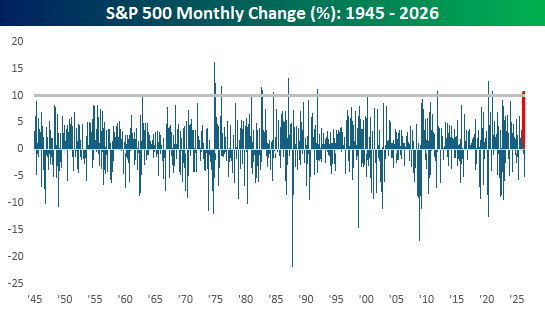
The scatter chart below compares the S&P 500’s monthly change since 1945 to where it was trading relative to a 52-week high at the start of each month. Below that, we have zoomed in on the months that had double-digit percentage gains. At the start of this April, the S&P 500 was just over 6% below its 52-week high, and while that wasn’t the closest the index was trading to a high at the start of a double-digit percentage month, it was close. For all months with double-digit gains, the S&P 500 was trading an average of 15.0% (median: -10.7%) from a 52-week high at the start of the month.
Start a two-week trial to Bespoke Premium to continue reading today’s full Morning Lineup.
Apr 30, 2026
See what’s driving market performance around the world in today’s Morning Lineup. Bespoke’s Morning Lineup is the best way to start your trading day. Read it now by starting a two-week trial to Bespoke Premium. CLICK HERE to learn more and start your trial.
“We are seeing unprecedented internal and external demand for AI compute resources.” – Anat Ashkenazi, CFO, Alphabet
Below is a snippet of commentary from today’s Morning Lineup. Start a two-week trial to Bespoke Premium to view the full report.
It was called a make-or-break night for earnings, and the bulls made it through. While the four major hyperscalers aren’t moving in unison this morning, futures are higher with the Nasdaq leading the way, trading up 0.5% while the S&P 500 is up slightly less (+0.40%). Next on the list? Apple (AAPL) after the close. Treasury yields are moving lower after yesterday’s spike, while crude oil is finally seeing a pullback for a change, although WTI is still trading at $105 per barrel. Gold and Bitcoin are both trading up by about 1%.
International markets had a mixed session. Asian stocks declined pretty much across the board, with Japan down just over 1%, but the yen surged as the BoJ gave a final warning regarding yen intervention. In Europe, stocks are generally higher with the STOXX 600 trading up 0.7%, led higher by the FTSE 100, which is up over 1%.
It’s a busy day for economic data in the US on top of tons of earnings, and outside of Chicago PMI at 9:45, all of the reports hit the tape at 8:30. We don’t have time to go through all of them here, but the results were generally OK. GDP was weaker than expected, inflation data was generally inline, Personal Income was stronger than expected, and jobless claims were much better than expected as initial claims fell below 200k!
This morning on CNBC, in a conversation between Gary Gohn and Andrew Sorkin, the former highlighted several positive aspects of the US economy right now. In response, Sorkin asked if it was “right that the market is just ignoring what’s going on in the Middle East right now?” It may feel as though, with the market hitting new highs, that it is ignoring what’s going on in the Middle East, but the reality is that up until this point, it hasn’t had much of an impact on the US economy.
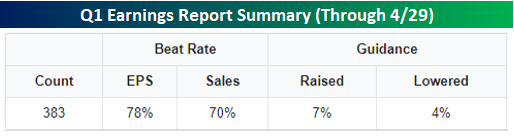
Over the last several weeks, we’ve cited numerous examples of economic data coming in better than expected, and last week’s Beige Book reinforced that trend. The Fed is even less concerned about economic weakness now than it was several weeks ago. This morning, jobless claims dropped below 200K! The latest round of earnings reports also reinforces this trend. Through yesterday, 78% of companies reporting exceeded EPS forecasts while 70% topped revenue estimates.
Those numbers are impressive but also backward-looking. What really stands out is the guidance. 7% of companies reporting have raised guidance this earnings season compared to just 4% that have lowered estimates. These companies see the same dire headlines regarding the Middle East each morning as you and I, but they also see what’s going on in their businesses. Things are strong enough that they feel confident in raising forecasts when they could easily use the uncertainty over the war and energy markets as an excuse to play it conservative.
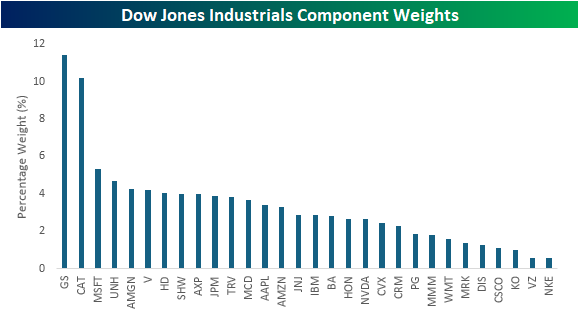
Yesterday’s earnings headline was the hyperscalers and how companies representing around 18% of the S&P 500’s market cap reported in one after-hours session. It wasn’t just the S&P 500. Since the close yesterday, companies representing more than 20% of the Dow reported earnings, but the main drivers weren’t Microsoft (MSFT) or Amazon.com (AMZN). These two companies represent a combined 8.7% of the index, but the big kahuna reporting in the Dow is Caterpillar (CAT). Because the Dow is price-weighted and CAT has a share price above $800 (second largest behind Goldman Sachs), it alone has a weighting of more than 10% in the index.
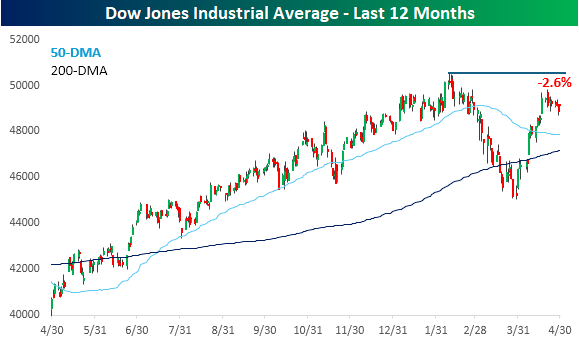
With shares of CAT trading up $48 in response to earnings, its gain will push the Dow higher by 300 points this morning. Combining that with the loss in MSFT and the gains in Amazon.com (AMZN) and Merck (MRK), these four companies will have a net positive impact of 320 points at the open. While that works out to a gain of over 0.6% for the index this morning, it still won’t be enough to push the Dow to new highs, as it would still be 2.6% below its record high from earlier in the year.
Start a two-week trial to Bespoke Premium to continue reading today’s full Morning Lineup.
Apr 29, 2026
See what’s driving market performance around the world in today’s Morning Lineup. Bespoke’s Morning Lineup is the best way to start your trading day. Read it now by starting a two-week trial to Bespoke Premium. CLICK HERE to learn more and start your trial.
“We live in a world defined by the rapid pace of technological change.” – Jerome Powell
Below is a snippet of commentary from today’s Morning Lineup. Start a two-week trial to Bespoke Premium to view the full report.
US futures point to a positive open driven mostly by tech stocks, and more specifically, AI-related stocks. The S&P 500 is indicated to open fractionally higher, while the Nasdaq is on pace to gain 0.3%. Treasury yields are modestly higher, while WTI crude oil adds another 3.5% to $103.4 per barrel. Yields and crude oil can’t keep rising like this without having at least some impact on equities.
In Asia, it was mostly a positive session, although Japan was closed. Chinese and South Korean stocks both rallied about 0.75%, although Australian stocks declined 0.2%. European stocks are lower across the board, with the STOXX 600 down 0.4% as UK stocks lead the way lower, down 0.8%.
It’s a relatively busy day for data, with Building Permits and Housing Starts at 8:30, along with Wholesale Inventories and Durable Goods. Then, at 2 PM, we’ll get the last FOMC statement under the Powell Fed, followed by his last press conference at 2:30. All of these events will play second fiddle, though, to earnings reports from the hyperscalers after the close.
There’s a Fed meeting today, but markets expect little to come out of it. This will be Fed Chair Powell’s last meeting leading the Fed, so there’s little reason to expect comments that have any potential to rock the boat. Rather, Powell will likely want to hand off a clean slate to the incoming likely Chair, Kevin Warsh. The main headline coming out of the press conference this afternoon will likely be news over whether Powell plans to stay on the committee once he steps down as chair.
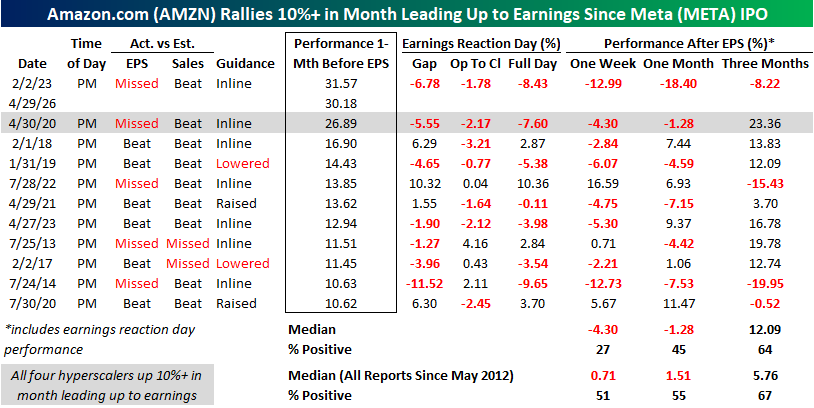
Instead of the Fed, investors will be more focused on the upcoming batch of earnings reports after the close from hyperscalers Amazon.com (AMZN), Alphabet (GOOGL), Meta (META), and Microsoft (MSFT). Not only are these among the largest companies in the world, but they’re also spending more on AI than just about any other company in the world. It’s also an incredible juxtaposition to see all four of these companies that plan to collectively spend more than $650 billion on capex this year reporting today. Then tomorrow, Apple (AAPL), the third-largest company in the world, but whose cap ex is peanuts compared to its other mega-cap peers, reports tomorrow. They’re all enormous companies, but they couldn’t be more different in terms of their AI investments.
Below, we wanted to provide a snapshot of the recent earnings reports since the launch of ChatGPT for each of the four hyperscalers and how their stocks reacted to each report.
Starting with AMZN, the bar is somewhat high given its run lately, but the stock is coming off a quarter where it missed EPS forecasts for the first time in three years. Following its last five earnings reports, the stock has declined on its earnings reaction day.
Start a two-week trial to Bespoke Premium to continue reading today’s full Morning Lineup.