Jun 29, 2026
See what’s driving market performance around the world in today’s Morning Lineup. Bespoke’s Morning Lineup is the best way to start your trading day. Read it now by starting a two-week trial to Bespoke Premium. CLICK HERE to learn more and start your trial.
“Real men despise battle, but will never run from it.” – George Washington

Below is a snippet of commentary from today’s Morning Lineup. Start a two-week trial to Bespoke Premium to view the full report.
After an unusual week where the S&P 500 traded lower every day but market breadth remained positive, leaving the average S&P 500 stock up 0.20%, investors are heading into the short week looking to push the indices higher. The S&P 500 is priced to open 0.8% higher, while the Nasdaq is poised to gain more than 1%. Investors will be watching mega-caps and memory stocks, which both came under pressure late last week, to see if they can get back on track.
Treasury yields are little changed, while oil trades up over 1% to $70 per barrel. Regarding oil, it could be worse as the US and Iran lobbed strikes at each other over the weekend but have since agreed to pause any strikes ahead of talks tomorrow. Gold prices are down about 1% while Bitcoin rallies just over 2% and moves back above $60K.
In Asia, it was a relatively quiet start to the week relative to recent trading. The Nikkei rallied 0.2% while South Korea fell 0.2%. Chinese stocks saw a little more action, rallying more than 1%. In Europe, stocks are mostly lower, but the losses have been modest. The STOXX 600 is down only 0.1% while France and the UK lead the losses with a decline of 0.4%.
In the US today, there’s not much data, but later in the week, we’ll have several key economic reports capped off with the June employment report on Thursday. In earnings news, some of the reports to focus on will be AeroVironment (AVAV) after today’s close and Constellation Brands (STZ) and Nike (NKE) after the close tomorrow.
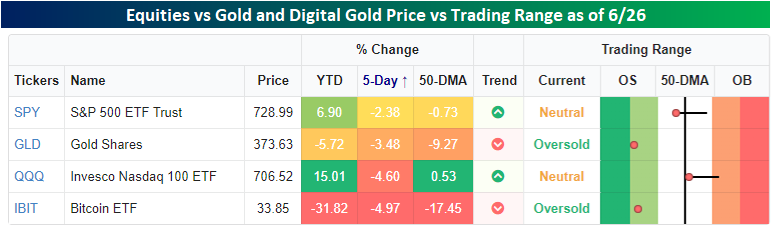
As bad a week as it was for the S&P 500 last week, it was even worse for both physical gold and its digital cousin (Bitcoin). Physical gold, as measured by the Gold ETF (GLD), fell more than a percentage point more than the S&P 500, while Bitcoin, as tracked by the Bitcoin ETF (IBIT), lost nearly 5%. Bitcoin’s performance was even worse than the Nasdaq 100 ETF (QQQ), which some would consider a more digital version of the S&P 500. While equities, gold, and Bitcoin were all down last week, the weakness was more of an anomaly relative to this year’s trend for equities, while it was a continuation of a trend of weakness for gold and Bitcoin, which were both already down YTD heading into last week.
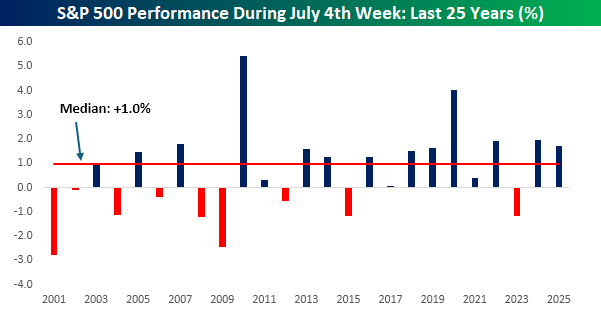
The rally in futures this morning comes right on cue for what is typically a positive time of year for equities. As shown in the chart below, the S&P 500’s median performance during the July 4th week over the last 25 years has been a gain of 1.0%, with positive returns just under two-thirds of the time. In more recent years, performance has been even stronger with a median gain of 1.6% and positive returns nine out of ten times.
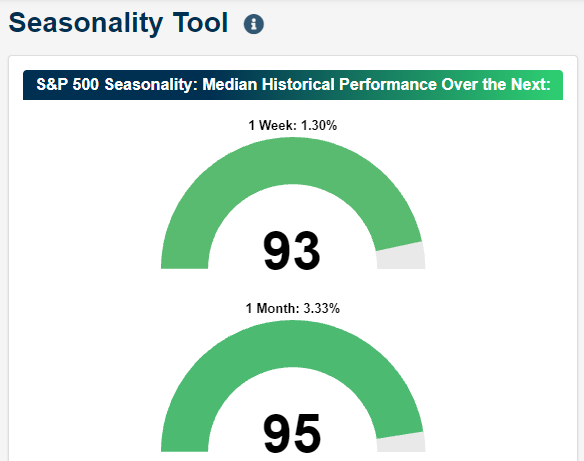
The strong seasonal tailwind shows up in our Seasonality Tool as well. As shown in the snapshot below, the S&P 500’s median one-week and one-month returns from the close today rank in the 93rd and 96th percentile relative to all other periods of the year with gains of 1.3% and 3.45%, respectively.
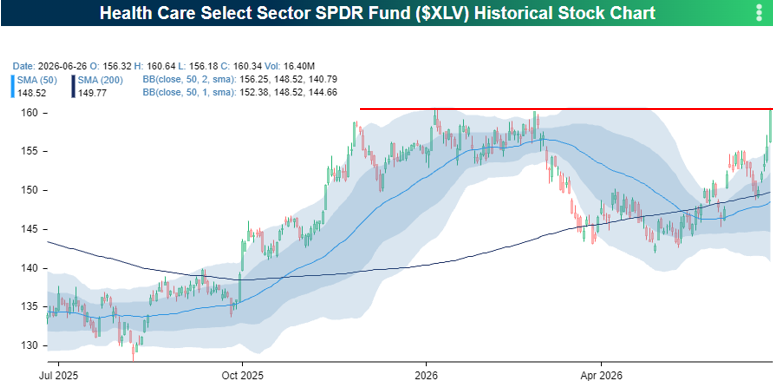
Even with the S&P 500 down over 2% last week, most sectors finished higher. Leading the charge were Real Estate (XLRE), Utilities (XLU), and Health Care (XLV), which were all up over 3%. Health Care’s massive 7%+ surge was its largest single-week gain in over a year, single-handedly rescuing the sector from a YTD loss to a 3%+ gain.
As shown in the chart below, last week’s rally took the sector ETF right up to key resistance around $160. This is a formidable ceiling: XLV failed to break it three times late last year and early this year, and it previously stalled out there back in the summer of 2024. The sector has now had about two years to convalesce, so we’ll see if this base is strong enough to finally push it into a higher trading range.
Start a two-week trial to Bespoke Premium to continue reading today’s full Morning Lineup.
Jun 26, 2026
See what’s driving market performance around the world in today’s Morning Lineup. Bespoke’s Morning Lineup is the best way to start your trading day. Read it now by starting a two-week trial to Bespoke Premium. CLICK HERE to learn more and start your trial.
“In bear markets, stocks usually open strong and close weak. In bull markets, they tend to open weak and close strong.” – William J. O’Neill
Below is a snippet of commentary from today’s Morning Lineup. Start a two-week trial to Bespoke Premium to view the full report.
After a strong start and intraday sell-off yesterday, futures have equities in the penalty box to start the last session of the week, so we’ll see if bulls can make a stand into the weekend. S&P 500 futures are down 0.40% while the Nasdaq looks to open down just over 1%. Treasury yields are modestly lower, while crude oil trades down more than 2.5% and barely hangs onto the $70 level. Gold prices are modestly higher, while Bitcoin looks to bounce but remains below $60K.
Asian stocks ended the week with a thud. The Nikkei was up over 1% heading into Friday’s session, but a 4.2% decline pushed that index into a 2.7% decline for the week. South Korea fell 5.8% in the session and 7.1% for the week, while onshore China stocks fell a relatively modest 2.3% and just 1.6% for the week. The main culprit for the weakness was in the technology sector, specifically memory stocks. Japanese inflation data didn’t help either as Tokyo CPI accelerated to 1.7% y/y at the headline level versus 1.4% in May,
European stocks don’t have nearly the exposure to technology that Asia and the US have, but that isn’t stopping indices in the region from falling. The STOXX 600 is down nearly 1%, putting it into negative territory for the week. Germany and the UK are leading today’s losses with declines of more than 1%, while Spain has been the region’s outperformer, falling just 0.4%. Looking on the bright side, a survey from the ECB showed consumer near-term inflation expectations falling from 3.9% down to 3.5%.
In the US today, the only economic reports on the calendar are Wholesale Inventories at 8:30, followed by Michigan sentiment at 10 AM. The Michigan report is notoriously negative, so don’t expect much optimism, although the survey of inflation expectations will be watched for signs of improvement.
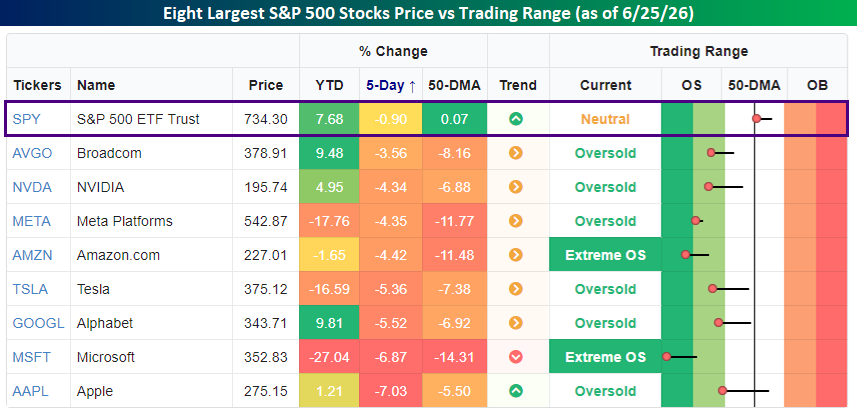
It’s been a rough June for megacap tech stocks. Through yesterday’s close, all eight of the largest S&P 500 stocks are below their 50-day moving averages, and in the case of Amazon.com (AMZN), Meta (META), Microsoft (MSFT), and Tesla (TSLA), they’re also below their 200-day moving averages.
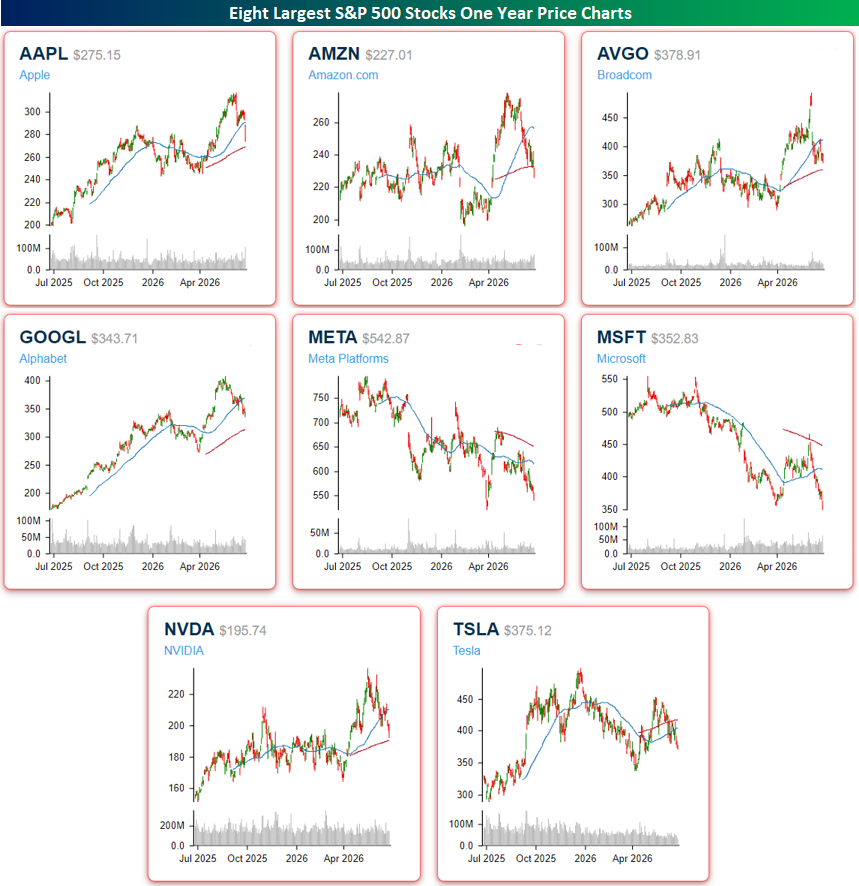
All eight stocks, which account for about 38% of the entire S&P 500, are down anywhere between 3.5% to 7.0% over the last week, and they’re all at oversold levels trading at least 5% below their 50-day moving averages. Despite these oversold levels in nearly 40% of the S&P 500, the index itself is down less than 1% over the last week and remains above its 50-day moving average.
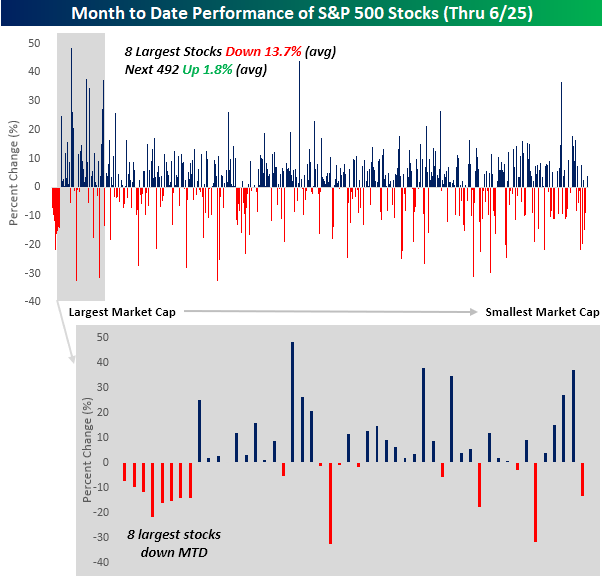
A look at the monthly performance of S&P 500 stocks shows the concentration of weakness among the largest S&P 500 stocks. The chart is sorted by market cap, so the largest stocks are on the left side of the x-axis, and the smallest ones are on the right. Note the deep concentration of red on the left. In fact, besides the eight largest stocks, there’s no other point in the chart where eight stocks in a row have negative returns this month!
Overall, the eight largest stocks in the S&P 500 are down an average of 13.7% this month, while the next 492 are up an average of 1.8%. In June, bigger hasn’t been better.
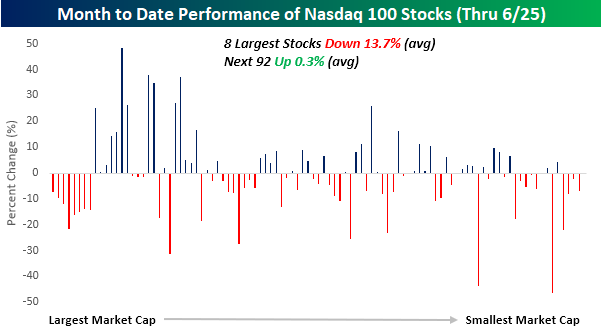
For the Nasdaq 100, it has been a similar trend. The eight largest stocks in the Nasdaq 100, which are also the eight largest stocks in the S&P 500, are down an average of 13.7%, and all are lower this month. Among the 92 other stocks in the index, though, the average performance this month has been a 0.3% gain.
Start a two-week trial to Bespoke Premium to continue reading today’s full Morning Lineup.
Jun 25, 2026
See what’s driving market performance around the world in today’s Morning Lineup. Bespoke’s Morning Lineup is the best way to start your trading day. Read it now by starting a two-week trial to Bespoke Premium. CLICK HERE to learn more and start your trial.
“Nothing is invented, for it’s written in nature first.” – Antoni Gaudi
Below is a snippet of commentary from today’s Morning Lineup. Start a two-week trial to Bespoke Premium to view the full report.
Futures are higher across the board this morning, and bulls have Micron (MU) to thank after the company reported blowout earnings with strong margins. Gross margins in the quarter were over nearly 85%, and the company guided margins to 86% next quarter. For perspective, the peak quarter of margins for Nvidia (NVDA) during its run was 77.4% in Q1 2025!
In response to the report, Nasdaq futures are poised to open higher by more than 2% while the S&P 500 looks to gain 0.66%. The lift in futures after the close also led to a rally in Asian stocks overnight, which has flowed over to Europe. Despite the big gain in equities, treasury yields are slightly lower, which should help buoy equities. Crude oil prices are down over 1% and have now essentially erased all their Iran war gains. Gold prices are below $4,000, and crypto is attempting to bounce with a gain of 2.6% but is still below $62,000.
It’s been an incredibly busy day for economic data. The revision to Q1 GDP came in higher than expected. Initial Jobless Claims came in lower than expected, while PCE data was mostly inline, so there wasn’t much in the data to disrupt the rally in equities.
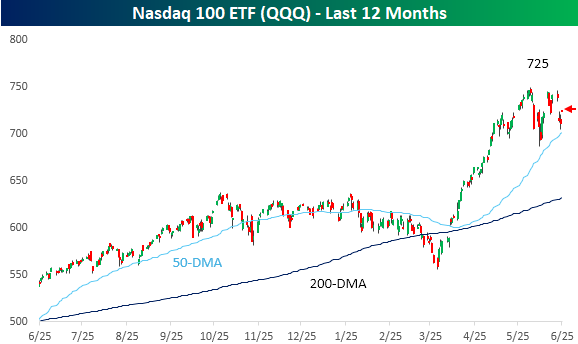
Last night’s earnings results from Micron (MU) have the Nasdaq poised to gap up by roughly 2% at the open, and it comes after another brief dip in which the Nasdaq 100 ETF (QQQ) came close to testing its 50-day moving average (DMA). After the last bounce failed to make a new high, traders will want to see this bounce make a higher high.
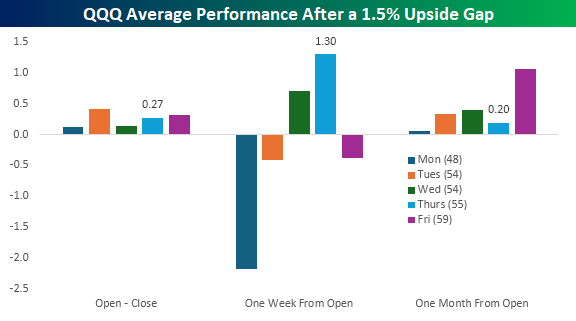
The chart below shows the performance of QQQ following upside gaps of at least 1.5% since 1999. In it, we have broken down returns by the day of the week. On the 55 prior days when QQQ gapped up more than 1.5% on a Thursday, its average return from the open to close was +0.27%. One week from the opening gap, QQQ averaged a gain of 1.3%, which is better than any other day of the week. However, the average 0.20% gain in the month after the prior 1.5% upside Thursday gaps is the second-weakest, trailing only Monday upside gaps.
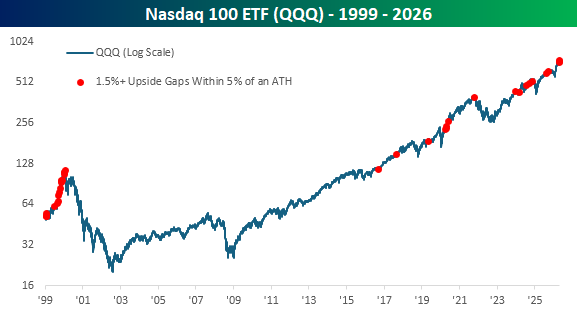
Looking at a long-term chart of QQQ since its inception in 1999, 1.5%+ upside gaps within 5% of an all-time high were frequent in the run-up to the dot-com peak. The frequency obviously dried up after the bubble burst when there wasn’t a new high for more than a decade. Since QQQ first returned to new highs in the last ten years, though, the frequency of these occurrences has been somewhat steady, although the frequency has picked up this month with three occurrences in just the last two weeks.
Start a two-week trial to Bespoke Premium to continue reading today’s full Morning Lineup.
Jun 24, 2026
See what’s driving market performance around the world in today’s Morning Lineup. Bespoke’s Morning Lineup is the best way to start your trading day. Read it now by starting a two-week trial to Bespoke Premium. CLICK HERE to learn more and start your trial.
“The most effective leader is the one who satisfies the psychological needs of his followers.” – David Ogilvy
Below is a snippet of commentary from today’s Morning Lineup. Start a two-week trial to Bespoke Premium to view the full report.
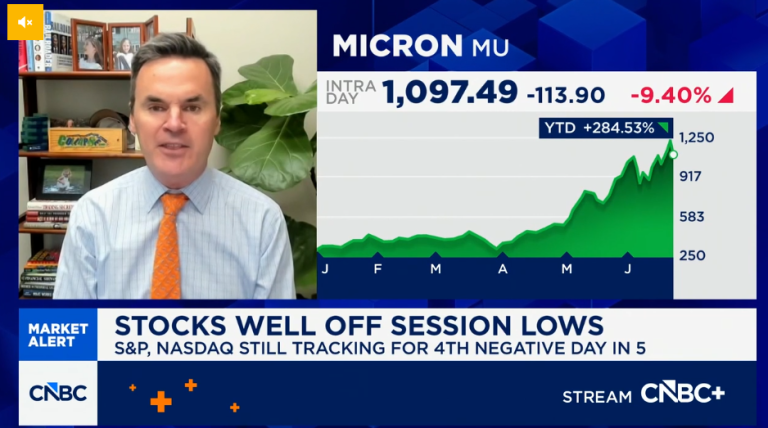
Paul Hickey appeared on CNBC’s Squawk on the Street yesterday to discuss the sell-off in tech and rotation into other sectors. To view the segment, click on the image below.
Stocks are looking to recoup some of Tuesday’s losses as Nasdaq futures rally 0.6% and the S&P 500 stands to gain 0.3%. Bond yields are lower, with the 10-year Treasury falling back down to 4.5% while WTI oil prices drop 3% to $71 per barrel. Gold prices are also down over 2% and not far from breaking the psychologically important level of $4,000 per ounce. Bitcoin is moving in the opposite direction, rallying nearly 1%.
It’s a slow day for data, with New Home Sales being the only economic report on the calendar, but after the bell, investors will be focused on Micron (MU) earnings, which are sure to cause some big moves in the memory sector.
Asian stocks generally rebounded overnight, except for Japan, which fell 0.9%. South Korea bounced 3.3%, erasing one-third of its losses from Tuesday’s session, while Chinese stocks were up fractionally. Traders in South Korea were somewhat comforted by news that Samsung would buy back $58 billion in stock, while SK Hynix said it would proceed with its US listing in early July.
In Europe, the STOXX 600 is slightly lower. French stocks are outperforming with a slight gain, while Germany is the big laggard, falling over 1%. Weakness in Europe’s largest industrial economy comes on the heels of reports that the German government cancelled plans to build six new warships, and that Rheinmetall shares plunging more than 15%.
Crude oil prices are lower again this morning, and WTI is down below $72 per barrel for the first time since March 3rd and below its 200-day moving average for the first time since April. Consider this: in May, crude oil prices averaged over $98 per barrel. Today, WTI is 27% lower.
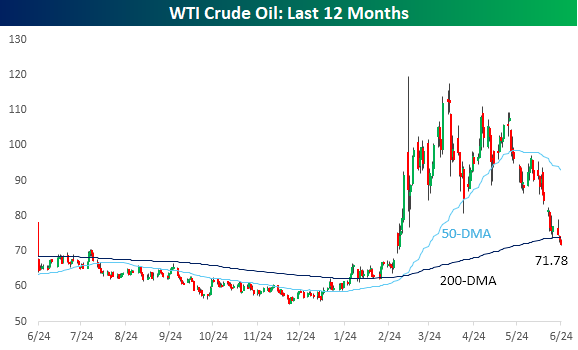
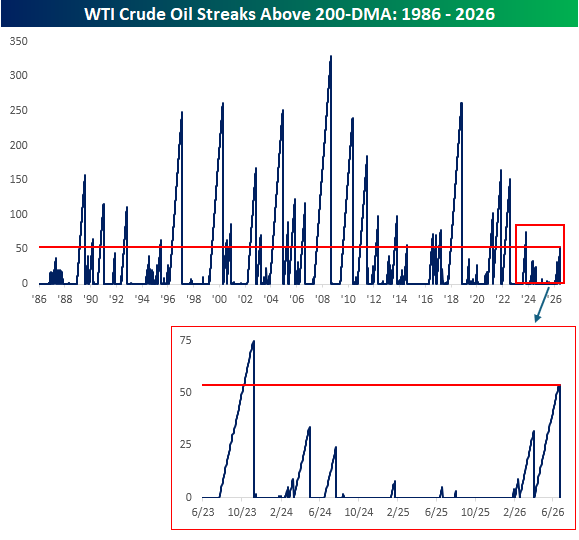
Yesterday’s decline in WTI ended a streak of 54 trading days where the commodity closed above its 200-DMA. As shown in the chart below, that’s far from extreme on a historical basis, but it was the longest streak in nearly three years.
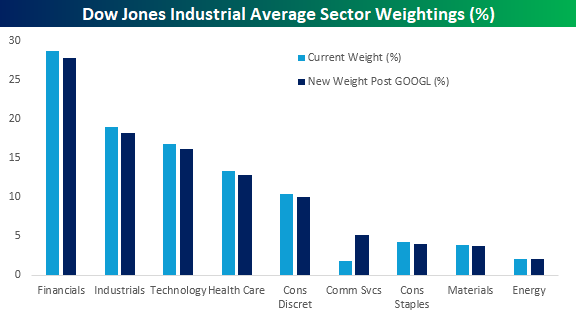
Outside of Energy, S&P Global announced last night that Alphabet (GOOGL) would replace Verizon (VZ) in the Dow Jones Industrial Average. While both stocks are in the Communication Services sector, it will have a notable impact on sector representation in the index. Not because GOOGL has a market cap that’s more than 20 times greater than VZ’s, but instead because its share price is 7.5 times greater (and the Dow is a share price-weighted index).
As the chart below illustrates, every other sector in the will see its weighting decline marginally while Communication Services will see its weighting increase from 1.8% to 5.2% of the index.
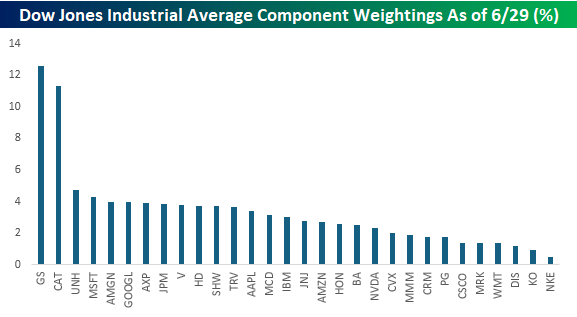
At the individual stock level, based on yesterday’s closing levels, GOOGL will enter the Dow as the sixth-largest component in the index with a weighting of just under 4%. As shown in the chart below, thirteen of the index’s 30 components have weights of between 3% and 5%, but the big outliers are Goldman Sachs (GS) and Caterpillar (CAT). With GS having a share price of nearly $1,100 and CAT closing yesterday just below $1,000, both stocks have weightings of more than 11% each. At the other end of the spectrum, after VZ’s removal, Coca-Cola (KO) and Nike (NKE) will be the only two stocks in the index with weightings below 1%.
Start a two-week trial to Bespoke Premium to continue reading today’s full Morning Lineup.
Jun 23, 2026
See what’s driving market performance around the world in today’s Morning Lineup. Bespoke’s Morning Lineup is the best way to start your trading day. Read it now by starting a two-week trial to Bespoke Premium. CLICK HERE to learn more and start your trial.
“The most effective leader is the one who satisfies the psychological needs of his followers.” – David Ogilvy
Below is a snippet of commentary from today’s Morning Lineup. Start a two-week trial to Bespoke Premium to view the full report.
Make sure to check out Paul Hickey on CNBC’s Squawk on the Street at 10 AM today.
We’re witnessing a global sell-off in equities as S&P 500 futures are down over 1% while the Nasdaq stares at a decline of more than 2.5%. The weakness comes as crude oil prices fall to the lowest levels in months and treasury yields are lower, two trends that would normally be viewed as positive for stocks! Asian stocks were sharply lower overnight, and that weakness flowed through into Europe as well, as the STOXX 600 falls over 1%. Flash PMI readings released this morning showed positive moves in the Manufacturing sector but weakness in the Services sector.
Tech is the main driver of the weakness, though. The S&P 500 Equal Weight Index is down less than 0.5%, and most other sectors are faring much better than tech this morning. While Technology is down over 3%, Financials is barely lower, and Health Care is up in the pre-market. This divergence is a reversal of the quarter-to-date trend, where Technology was the only sector outperforming the market in Q2. That’s unsustainable.
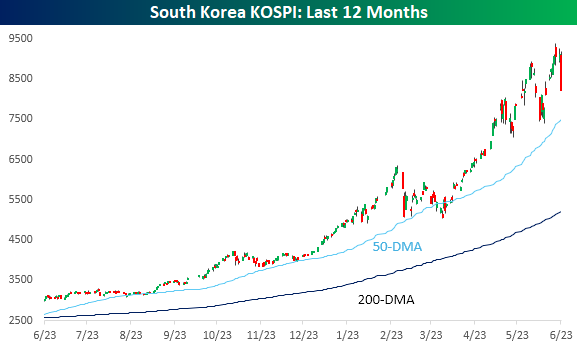
The carnage in US equity futures started overnight in South Korea, where the KOSPI declined 9.99% for its largest daily decline since… March 4th. Usually, 5%+ declines for a major global index are a big deal, but for the KOSPI, last night’s was the third this month! And if you think that’s volatile, in March there were four 5%+ daily moves.
For the KOSPI, today’s 10% decline shows up as a large red candle in the chart, but like the prior two periods of decline the index has had since April, it remains nearly 10% above its 50-day moving average and 58% above its 200-DMA. So, by any traditional or objective measure, it is still overbought.
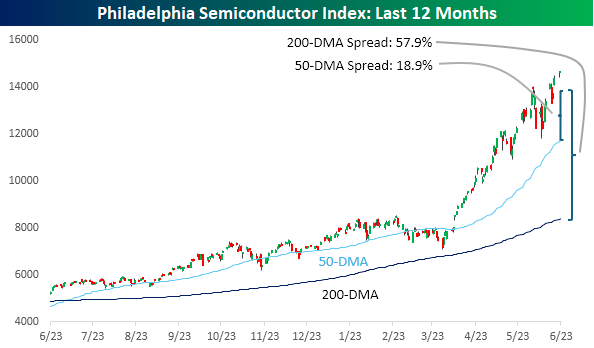
Semiconductor stocks have been the hottest sector of the market during Q2, and as of yesterday, the Philadelphia Semiconductor Index (SOX) was up over 90%. 90%! Today, the index is on pace to trade down about 6%, which wouldn’t even be the worst day this month. That was on 6/5 when it fell over 10%. Even after a decline of 6%, though, the SOX would be 18.9% above its 50-DMA and 57.9 above its 200-DMA. Like the KOSPI, still overbought.
Start a two-week trial to Bespoke Premium to continue reading today’s full Morning Lineup.
Jun 22, 2026
See what’s driving market performance around the world in today’s Morning Lineup. Bespoke’s Morning Lineup is the best way to start your trading day. Read it now by starting a two-week trial to Bespoke Premium. CLICK HERE to learn more and start your trial.
“I know you think you understand what you thought I said but I’m not sure you realize that what you heard is not what I meant.” – Alan Greenspan
Below is a snippet of commentary from today’s Morning Lineup. Start a two-week trial to Bespoke Premium to view the full report.
After a long weekend, markets appear to be stuck in snooze. The S&P 500 is indicated to open 0.03% lower, while the Nasdaq prices in a gain of less than 0.2%. Treasury yields are modestly higher, but the 10-year yield remains below 4.5%. Oil Prices are modestly lower after Iran noted “major progress” in talks with the US. Gold is fractionally lower while Bitcoin bounces and makes a run towards $65K.
There’s some sad news to report this morning as former Fed Chair Alan Greenspan passed away at the age of 100. Greenspan earned the nickname “The Maestro” not just because he was credited with steering the economy through the longest peacetime expansion in history, but also because he was an accomplished musician who attended the Juilliard School, where he played the clarinet and sax.
Asian markets started the week on a positive note. The Nikkei 225 rallied 1.6% while South Korea gained 0.7%, with both hitting record highs. Hong Kong’s Hang Seng bucked the bullish trend, falling 0.7%. The big news in South Korea’s rally was SK Hynix overtaking Samsung as the country’s largest company by market cap after the stock has tripled – yes, tripled – since February.
In Europe, it’s been a listless session to start the week. The STOXX 600 is basically unchanged, while UK stocks are up fractionally following news that PM Starmer will resign. To the downside, Germany, France, and Italy are all down around 0.5% or less.
In the US today, there’s no economic or earnings data on the calendar.
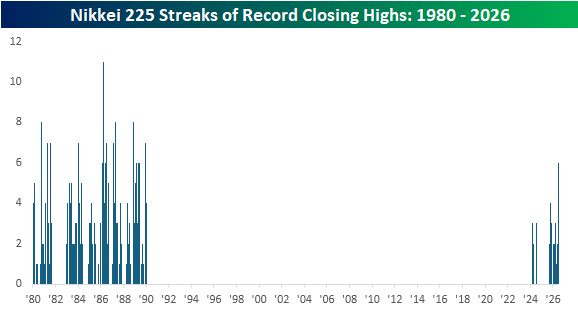
With Japanese stocks rallying overnight, the Nikkei 225 did something it hasn’t done in 37 years by closing at a record high for six straight sessions. The chart below shows streaks of all-time closing highs in the Nikkei 225, and it is one of the stranger charts you’ll see, given that the index went decades without hitting a record high after the bubble burst in 1989. Before 1989, there were multiple streaks of six or more record highs, but the current one is the longest since 1989.
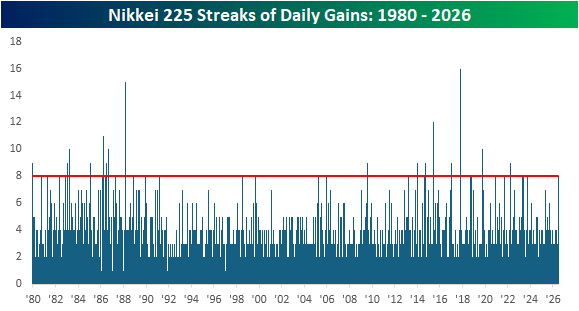
In addition to closing at six straight record highs, the Nikkei has also closed higher for eight straight sessions, and those types of streaks have been frequent throughout history, even during the drought of all-time highs. This current streak of higher closes is the first eight-day streak since September 2023 and tied for the longest since March 2022.
Start a two-week trial to Bespoke Premium to continue reading today’s full Morning Lineup.