Jul 8, 2026
See what’s driving market performance around the world in today’s Morning Lineup. Bespoke’s Morning Lineup is the best way to start your trading day. Read it now by starting a two-week trial to Bespoke Premium. CLICK HERE to learn more and start your trial.
“They’re scum. You know what scum is? They’re scum…As far as I’m concerned, it’s over.” – Donald Trump

Below is a snippet of commentary from today’s Morning Lineup. Start a two-week trial to Bespoke Premium to view the full report.
Talk about a bad breakup. In the wake of President Trump’s comments regarding Iran and the ratcheting up of military tensions in the region, global equities are reeling. Futures for the S&P 500 are down close to 1%, while the Nasdaq sits on losses of closer to 1.5%. As you’d expect, WTI crude oil is up over 5% to just under $75 per barrel. Even with the risk-off sentiment in the market, Treasury yields are also higher as the 10-year yield moves up 5 bps to 4.57%. Gold is also plunging more than 2% to $4,060 per ounce, going against its usual role as a safe-haven bid, and Bitcoin is down 2.5% to just above $62,000.
It was another day of red for Asia as the Nikkei fell over 2%, and the Kospi tanked another 5.4%. The index has now declined more than 20% from its high just over two weeks ago on 6/22. The only global benchmark in the region trading higher was Hong Kong, which rallied 3% on reports that the Chinese government would limit access from foreigners to the country’s top AI models.
European stocks aren’t faring much better than Asia. The STOXX 600 is down over 1.5%, led lower by Spanish stocks, which are down over 2.5% after President Trump called for an end to all US trade with the country after it refused to ramp up defense spending and denied the US access to its airspace during the US strikes on Iran.
The ‘break-up’ with Iran comes just as oil prices were starting to revert to their pre-war levels. After surging more than 68%, WTI crude oil prices closed within $2 of the pre-war levels on Monday but have since rallied more than 10%.
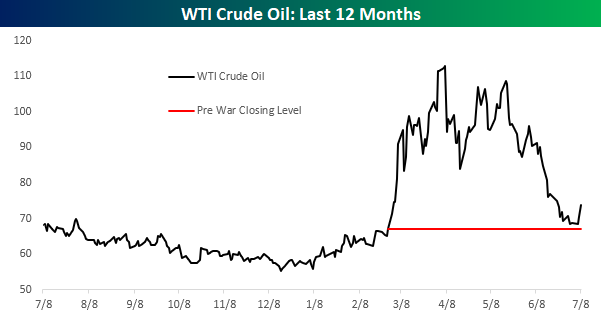
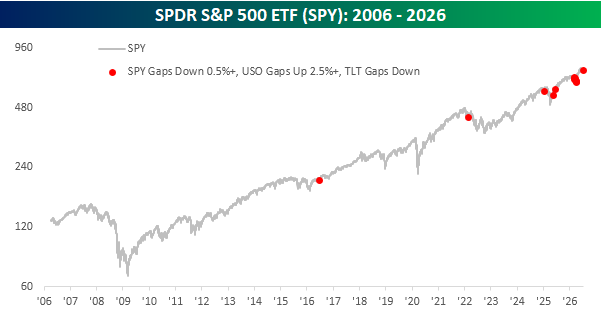
This morning, oil prices are up over 5%, and the Crude Oil ETF (USO) is on pace to gap up over 3%. Along with the rally in crude oil, equity prices are predictably on pace to gap down nearly 1%. As mentioned above, though, Treasuries are unexpectedly selling off. Since the launch of USO in 2006, today will only be the 14th day that USO gapped up at least 2.5%, the S&P 500 (SPY) gapped down at least 0.5%, and long-term Treasuries (TLT) gapped down.
The chart below shows each of those prior days on a chart of SPY. Stunningly, there wasn’t a single occurrence in the first ten years after USO’s launch, and then after the first occurrence in 2016, there wasn’t another for more than five years. Since the start of 2025, though, these types of mornings for the market have been increasingly common, and today’s open will be the ninth occurrence in the last four months!
Start a two-week trial to Bespoke Premium to continue reading today’s full Morning Lineup.
Jul 7, 2026
See what’s driving market performance around the world in today’s Morning Lineup. Bespoke’s Morning Lineup is the best way to start your trading day. Read it now by starting a two-week trial to Bespoke Premium. CLICK HERE to learn more and start your trial.
“You win a few, you lose a few. Some get rained out. But you got to dress for all of them.” – Satchel Paige
Below is a snippet of commentary from today’s Morning Lineup. Start a two-week trial to Bespoke Premium to view the full report.
Paul Hickey will be appearing on CNBC’s The Exchange today between 1 PM and 1:30 PM. Check it out if you’re near a screen!
It looks like a terrible Tuesday for the market as Nasdaq futures fall more than 1%, while the S&P 500 faces a more modest loss of 0.23%, and futures on the Dow are modestly higher. Despite the weakness in equities, Treasury yields are slightly higher, with the 10-year hitting 4.5%.
Crude oil is modestly higher after reports that Iran fired munitions at a cargo ship in the Strait of Hormuz. That raises levels of uncertainty for the region, but with WTI prices not even able to muster a 1% gain, markets don’t seem overly concerned. The fact that gold prices and Bitcoin are also lower by less than 1% also supports that idea.
The weakness in US futures traces back to weakness overnight in Asia, where the Nikkei fell over 2%, and South Korea’s Kospi plunged nearly 5%. The weakness in South Korea was tied to memory stocks, which plunged as Samsung declined close to 10% after the company said earnings wouldn’t be quite as stellar as previously thought.
In Europe, stocks are holding up much better. The STOXX 600 is down just 0.2% as world leaders meet for a NATO Summit. German stocks are the biggest laggards, falling more than 0.7% even as May Industrial Production rose 0.9%, versus expectations for an increase of 0.1%. Outside of Germany, most other major benchmarks in the region are modestly higher.
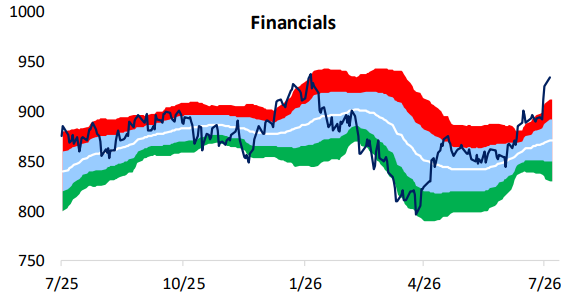
As tech stocks struggle to kick off Q3, Financials have picked up some of the slack. Over the last five trading days (dating back to the start of last week), the sector is up close to 5%. That makes it the top-performing sector, with a rally of a full percentage point higher than the next closest sector (Communication Services), and more than 1.5 percentage points ahead of Consumer Discretionary. As a result of the rally, the sector is more overbought than any other, as it closed more than three standard deviations above its 50-DMA yesterday.
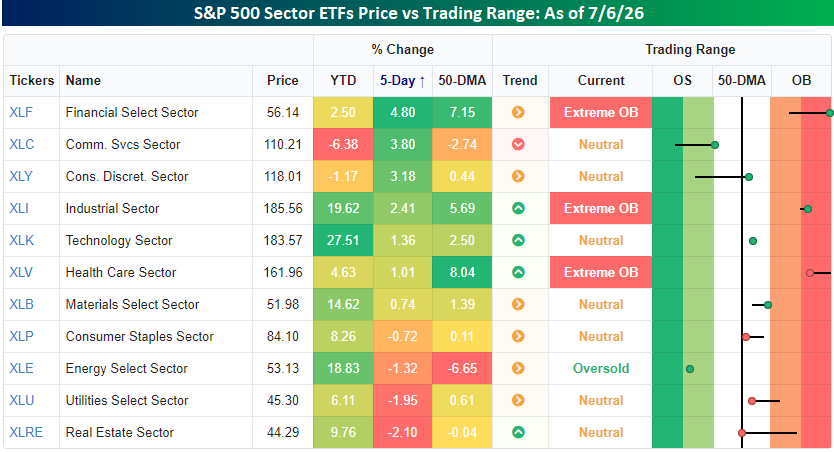
With the rally over the last few days, the Financials sector is back more than three standard deviations above its 50-day moving average, a level it reached back in early June. For more on how the sector has historically performed after reaching such extreme short-term overbought levels, see our Chart of the Day from June 17th (Chart of the Day – Cyclical Surge)
Start a two-week trial to Bespoke Premium to continue reading today’s full Morning Lineup.
Jul 6, 2026
See what’s driving market performance around the world in today’s Morning Lineup. Bespoke’s Morning Lineup is the best way to start your trading day. Read it now by starting a two-week trial to Bespoke Premium. CLICK HERE to learn more and start your trial.
“Philosophy is common sense with big words.” – James Madison
Below is a snippet of commentary from today’s Morning Lineup. Start a two-week trial to Bespoke Premium to view the full report.
US futures are coming back from the holiday weekend full of life, with the S&P 500 poised to gap up 0.5% at the open while the Nasdaq rallies more than 1%. Treasury yields are lower, with the 10-year yield moving down to 4.46%. Crude oil prices have seen little movement, with WTI trading right below $69 per barrel, and gold is rallying 1% to $4,167 per ounce. In crypto, Bitcoin is down over 1% and below $62K.
Asian markets kicked off the new week on a quiet note, with Hong Kong (+1.1%) the only benchmark to move up or down by more than 1%. The Nikkei declined 0.1% while South Korea declined 0.5%. China’s Shanghai Composite was also down 0.1%.
The tone for European stocks is similarly muted, but more skewed to the downside. The STOXX 600 is trading down 0.3% in early trading. Spanish stocks are leading the losses, down 0.8%, while French stocks are unchanged. Retail sales and PPI for the region both rose 0.2% in May and were both right in line with expectations.
The only data on the calendar today are Service sector PMIs from S&P and ISM, and the earnings calendar is blank with no real notable reports until Thursday when Pepsi reports before the open.
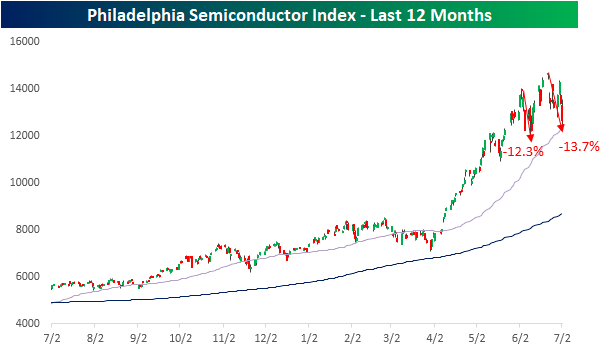
Semiconductor stocks really limped into the holiday weekend as the Philadelphia Semiconductor Index (SOX) fell 5.4% on Thursday following a 6%+ decline on Wednesday. That was the first back-to-back 5%+ declines in the index since April 2025. Those two declines alone were enough to put the SOX into correction territory, but with the index already off its highs heading into Wednesday’s session, it is now down 13.7% from its recent closing high. This current correction for the index comes less than a month after another 12.3% correction that ended in early June. Volatility in the SOX is clearly picking up.
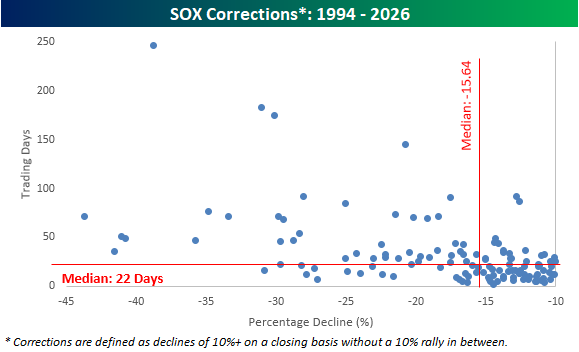
The chart below shows all 127 SOX corrections since its inception in 1994 in terms of time and price. Overall, the median correction has lasted 22 days (current correction has been 10 days) and experienced a peak-to-trough decline of 15.64%. So, the current period is less than halfway there in terms of time, but not far from the median in terms of price.
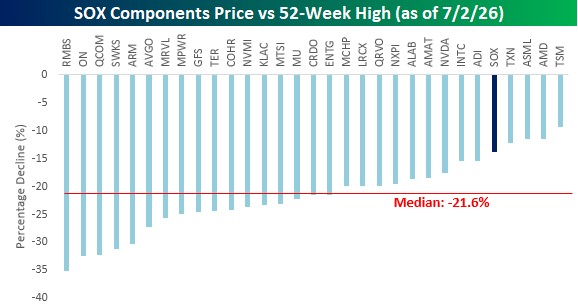
While the SOX itself is down nearly 14%, the individual stocks that make up the index have seen larger declines relative to their respective peaks. Only four of the index’s 30 components are currently in drawdowns of less than 15%, and the median decline has been 21.6%. The biggest losses have been in the shares of Rambus (RMBS), ON Semiconductor (ON), Qualcomm (QCOM), Skyworks (SWKS), and Arm Holdings (ARM), all of which are down over 30%. Nvidia (NVDA), the largest of the stocks in the index, has been a big underperformer on the way up, but on the way down, it hasn’t been quite as extreme as its current drawdown of 17.6% is four percentage points less than the median of the index’s 30 components.
Start a two-week trial to Bespoke Premium to continue reading today’s full Morning Lineup.
Jul 2, 2026
See what’s driving market performance around the world in today’s Morning Lineup. Bespoke’s Morning Lineup is the best way to start your trading day. Read it now by starting a two-week trial to Bespoke Premium. CLICK HERE to learn more and start your trial.
“Philosophy is common sense with big words.” – James Madison
Below is a snippet of commentary from today’s Morning Lineup. Start a two-week trial to Bespoke Premium to view the full report.
After a shaky start to the third quarter yesterday, equity futures remained wary ahead of the June Non-Farm Payrolls report, with the S&P 500 basically unchanged while the Nasdaq was up less than 10 basis points. Treasury yields are slightly higher, but the 10-year yield is back above 4.5%. The real story, though, is in the energy market, where WTI prices are down over 2% and back to where they traded before the war with Iran started. Gold prices are down fractionally, and Bitcoin is higher, trading back above $61K.
In Asia, it was a shaky night led lower by tech stocks as South Korea plunged nearly 8%, the Nikkei fell 2.5%, and China dropped 2%. That’s not the start of a quarter bulls would have hoped for, but it’s also not unexpected given the moves higher we saw in Q2.
In Europe, stocks are broadly higher with the STOXX 600 trading up over 0.5%, as Italy and Spain lead the way, gaining over 1%.
It’s a busy day for economic data as we pack a lot of reports into the day due to Friday’s holiday. The main report, though, was the Non-Farm Payrolls report, which came in weaker than expected. The initial read was 57K, or about half expectations. Despite the weaker print, the Unemployment Rate dropped to 4.2% versus forecasts for 4.3%. Also, Initial and Continuing Claims were both slightly lower than expected. So, the headline number may have been weaker than expected; other releases weren’t nearly as bad. When it comes to the Non-Farm Payrolls, the most important thing to remember is that the initial release is what you tell your wife you’re going to spend at Costco, and the revision is your credit card statement. They’re rarely the same!
As we kick off the second half, investors face no shortage of questions. Will earnings season live up to expectations? Will inflation cool? Will the ceasefire in the Middle East continue? Will the AI trade continue to keep the market afloat, or will the underperformance of mega-caps sink the rally? We can all take our best guesses at these questions, but only time will tell, and as events unfold, the market will continue to react with gains and losses.
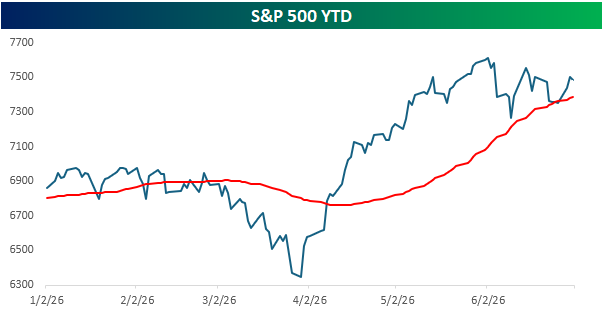
After a blistering rally off the March lows, investors are starting to question their recent optimism, which has caused the advance to stall. Heading into the last trading session before the July 4th holiday, the S&P 500 sits just above its 50-day moving average, so even on a short-term basis, the rally remains in place despite the sawtooth action of the last six weeks.
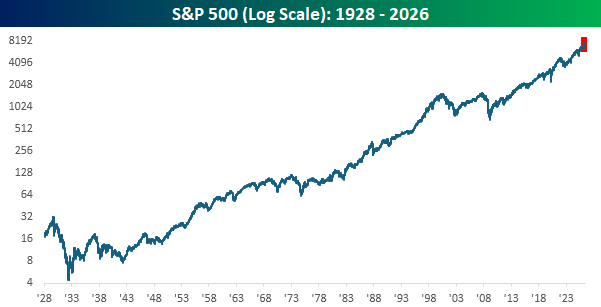
Regardless of how the market responds to these short-term questions, the most important thing to keep in mind is that over the last 250 years (to the day Saturday!), there has been no better investment than the US economy. The chart below goes back nearly a century, and the trend has been clear. It hasn’t been a straight line higher, but the last six months (red box) look inconsequential, and even the dark days of the Great Depression and the unwinding of the 1990s tech bubble don’t seem that bad. Most importantly, though, we got through them.
In real time, the road ahead won’t be smooth, but time has a way of smoothing out the rough edges, and $1 invested in the S&P 500 in 1928 would be worth more than $10,000 today. So, let’s all celebrate this weekend what makes this country the greatest place on earth and get back to work next week in the pursuit of making that $10,000 worth $100,000,000 by 2126! Happy 250th, everyone!
Start a two-week trial to Bespoke Premium to continue reading today’s full Morning Lineup.
Jul 1, 2026
See what’s driving market performance around the world in today’s Morning Lineup. Bespoke’s Morning Lineup is the best way to start your trading day. Read it now by starting a two-week trial to Bespoke Premium. CLICK HERE to learn more and start your trial.
“Either write something worth reading or do something worth writing.” – Benjamin Franklin
Below is a snippet of commentary from today’s Morning Lineup. Start a two-week trial to Bespoke Premium to view the full report.
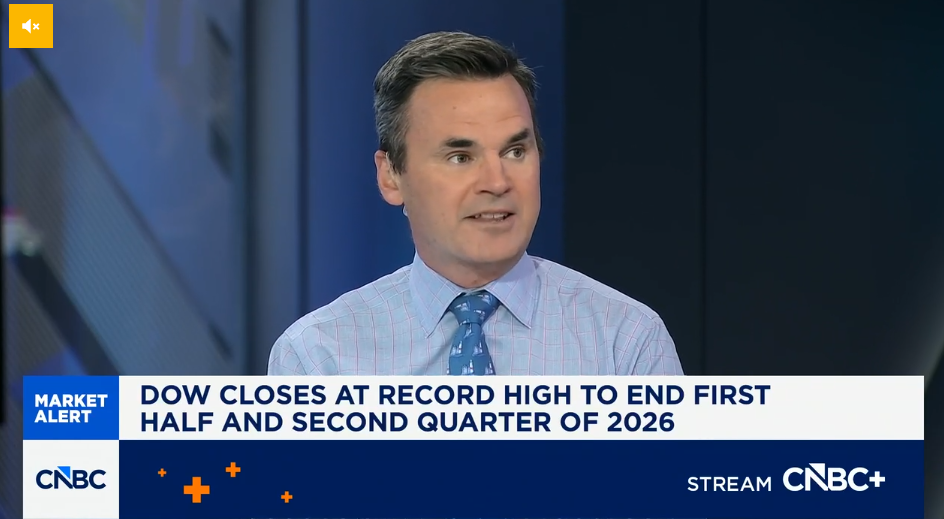
Paul Hickey appeared on CNBC’s Closing Bell Overtime yesterday after the close to discuss the first half performance and trends to look for in the second half. To view the segment, click on the image below. Paul will also be appearing on CNBC’s Power Lunch today at 2 PM.
Equity futures are kicking off the new half with modest losses. S&P 500 futures are down 0.2% while the Nasdaq is down 0.5%. Treasury yields are seeing a sizable uptick, with the 10-year yield up 7 basis points to 4.49%. Crude oil is fractionally lower and below $70 per barrel, while gold is fractionally higher and Bitcoin is marginally lower.
In Asia, markets started the quarter mixed, with the Nikkei gaining 0.6% as the yen weakened to 40+ year lows. China was also slightly higher, while South Korea declined by 2% as memory stocks showed weakness at the start of the quarter. In terms of regional economic data, manufacturing PMI indices were generally weaker than expected.
In Europe, stocks are mostly lower to start the month, but again, the losses are modest with the STOXX 600 trading down just 0.3%. Manufacturing PMIs were mixed, but the flash CPI for June unexpectedly declined 0.1% m/m, versus forecasts of a 0.1% increase.
On the economic calendar, we’ll get Manufacturing PMIs from S&P and ISM at 9:45 and 10, and the June ADP employment report just hit the tape with a weaker-than-expected print. While economists expected an increase of 120K jobs, the actual increase was just 98K. While weaker than expected, a miss that small relative to expectations will do little to upend the theme of an improved labor market.
In central bank news, we’ll hear from Fed Chair Kevin Warsh, along with ECB President Lagarde, in Sintra, Portugal, later this morning.
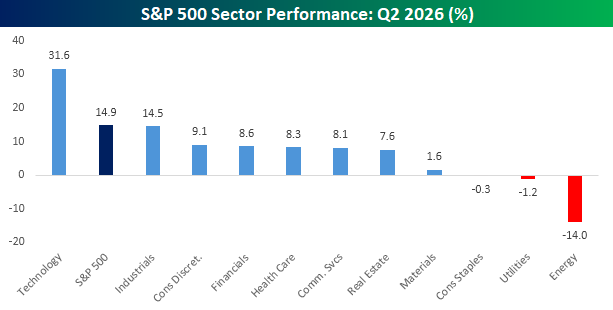
As we start a new month and quarter, we’d be remiss if we didn’t point out how unique the second quarter was in terms of sector performance. While the S&P 500 rallied nearly 15%, the only sector that generated any alpha and outperformed the index was Technology, and boy did it ever outperform as it more than doubled the gain of the S&P 500. Behind Technology, Industrials came close to the S&P 500 but finished just short with a gain of 14.5%.
Outside of these two sectors, no other sector even rallied more than 10%, and three sectors – Consumer Staples, Utilities, and Energy – all finished down for the quarter. That’s not particularly good if your portfolio is concentrated in those three sectors, but when the market rallies, it’s exactly the defensive sectors like these that you would expect to underperform.
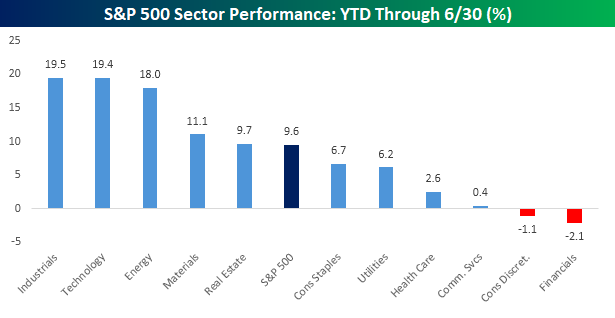
While there was very little in the way of sector breadth during the quarter, on a year-to-date basis, performance has been more balanced. As shown in the chart below, while the S&P 500 is up just under 10%, Industrials, Technology, and Energy all gained nearly double that, while Materials and Real Estate also outperformed. To the downside, Consumer Discretionary and Financials are the only two sectors in the hole for the year. If the economy continues to show signs of improvement in the second half, it would be hard to imagine these two sectors continuing to remain in the red.
Start a two-week trial to Bespoke Premium to continue reading today’s full Morning Lineup.
Jun 30, 2026
See what’s driving market performance around the world in today’s Morning Lineup. Bespoke’s Morning Lineup is the best way to start your trading day. Read it now by starting a two-week trial to Bespoke Premium. CLICK HERE to learn more and start your trial.
“Commerce with all nations, alliance with none, should be our motto.” – Thomas Jefferson
Below is a snippet of commentary from today’s Morning Lineup. Start a two-week trial to Bespoke Premium to view the full report.
US stocks are looking to close out what has been a very strong quarter on a positive note. S&P 500 futures are slightly higher with a gain of 0.10%, while the Nasdaq is up 0.25%. Treasury yields are slightly higher, with the 10-year yield trading just below 4.4%. Crude oil prices, along with gold, are slightly higher, while Bitcoin is down over 2% and trading back below $59K.
In Asia, stocks had a mixed session with the Nikkei rallying 0.9% and South Korea gaining 1.0%. In the other direction, Hong Kong fell 0.6%. Chinese PMI data for June came in slightly better than expected for both the Manufacturing and Services sectors, with both coming in above 50, the threshold for expansion. In South Korea, Retail Sales rebounded 0.1% in May after falling 3.5% in April, but Industrial Production fell 3.0%, accelerating April’s 0.7% pace of decline.
European stocks are closing out the quarter on a much stronger note. The STOXX 600 is up over 1%. Germany is leading the gains (even though they were knocked out of the World Cup) with a gain of 1.5%, while France and Spain are both up 0.6% or less. Along with the strength in German stocks, Retail Sales in the country surprised to the upside, rising 1.1% versus forecasts for no change. In France and Italy, there was also some good news on the inflation front as CPI for June came in weaker than expected.
Getting back to the US, the only data on the calendar is the Chicago PMI at 9:45 and Consumer Confidence and JOLTS at 10 AM. In terms of earnings, we’ll also get reports from Nike (NKE) and Constellation Brands (STZ) after the close. NKE is coming off back-to-back quarterly reports of falling by double-digits, while STZ has reacted positively to each of its last five reports.
With a gain of 21.3% YTD, the Russell 2000 is on pace for its best first half of the year since 1991.
Because almost all the gains were squeezed into Q2, the small-cap benchmark is on pace for a quarterly gain of over 20%, which would mark the best quarter since the Q4 2020 post-Covid reopening rally (+31%), which was also the largest quarterly gain in the index’s history.
As the chart below illustrates, the period coming out of Covid not only included the Russell’s strongest-ever quarter but also two quarters within a three-quarter period when it rallied more than 20%.
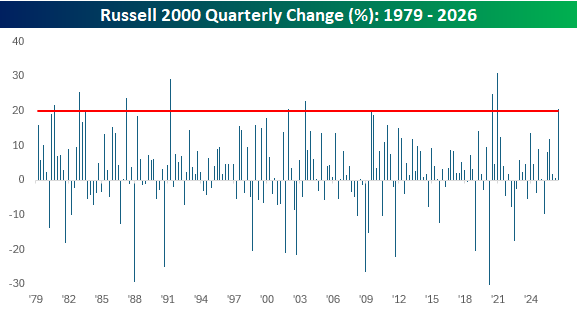
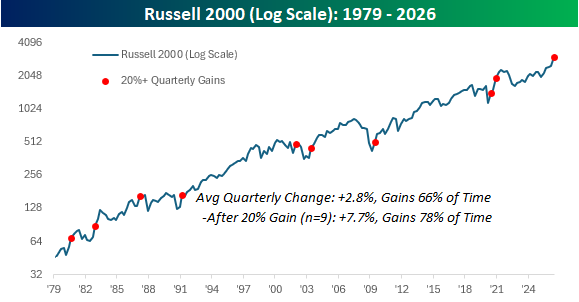
The chart below shows where each prior quarterly 20%+ gain occurred within the long-term history of the Russell 2000. They have occurred within all stages of bull market cycles, so it’s hard to say much in terms of what they indicate, but it is worth pointing out that following the nine prior quarterly gains of at least 20%, the Russell 2000’s average change in the following quarter was a gain of 7.7% with positive returns 78% of the time. That’s more than twice the 2.8% average gain for all periods since 1979.
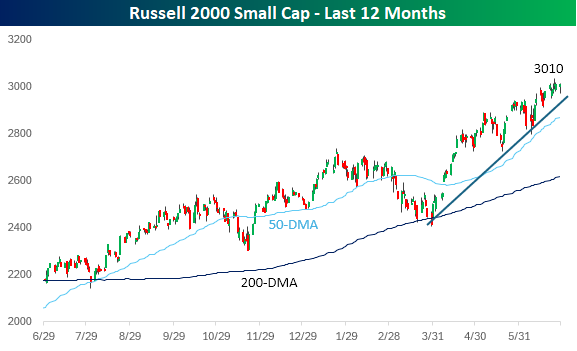
From a short-term perspective, small-caps look a bit stretched and have shown a slight loss of momentum over the past week. The index is also still trading 5% above its 50-day moving average, which means that a minor pullback wouldn’t even do significant technical damage.
The key test will be the recent index rebalancing. Many of the top-performing stocks that drove the Russell 2000 to these heights “graduated” to the Russell 1000 in last week’s rebalancing. For the rally to continue, the index will need some new blood to step up.
Start a two-week trial to Bespoke Premium to continue reading today’s full Morning Lineup.