Oct 22, 2018
China’s biggest stock rally in more than two years has US stocks looking to open higher, and the real strength is in the Nasdaq, where futures are indicating a gain of 0.7%. Economic data is relatively light today, and while there hasn’t been much in the way of earnings reports yet today, the pace will really pick up in the days ahead.
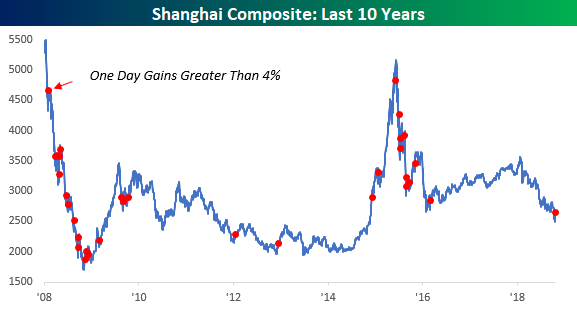
The big gain for Chinese equities overnight is definitely a welcome bullish move from an area of the world that currently keeps investors up at night, but looking back over the last ten years, we would note that 4% moves in Chinese equities haven’t typically come during periods of market strength. The red dots in the chart below show all occurrences of one-day moves of 4% or more for the Shanghai Composite since the start of 2008. While there were exceptions, most of the 32 prior instances came during the downward moves in 2008 and then in 2015.
Start a two-week free trial to Bespoke Premium to see today’s full Morning Lineup report. You’ll receive it in your inbox each morning an hour before the open to get your trading day started.

Oct 19, 2018
Yesterday wasn’t a fun day to be a bull. While the S&P 500 was close to unchanged late in the morning, sellers stepped in around lunch time and didn’t let up the entire day. Companies reporting earnings were even harder hit as the average stock reporting earnings after the close Wednesday or before the bell, Thursday fell an average of over 1.7% for the day. Today, equities are looking to make up some of that lost ground, but it’s still early on a Friday morning in October, so anything can really happen between now and the closing bell.
The economic calendar is pretty light today, with Existing Home Sales the only scheduled report, but we’ll also hear commentary from the Presidents of the Atlanta (Bostic) and Dallas Fed (Kaplan). In geopolitical/trade news, there’s a hint of optimism in the air as President Trump and Xi are expected to meet on the side at the G20 meeting later this month.
While Halloween is still 12 days away, the scariest day of the year for many equity investors is today, as it represents the anniversary of the 1987 stock market crash 31 years ago today. When you consider the fact that the S&P 500 fell 20% in a single day back in October 1987, the recent weakness seems like peanuts.
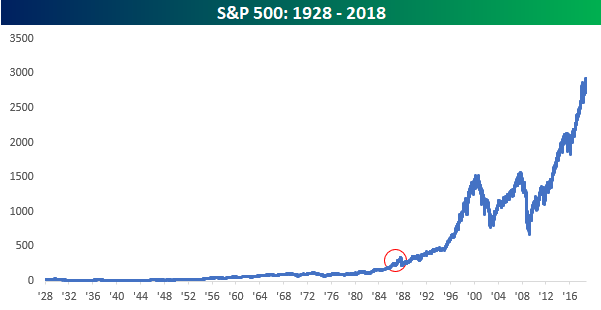
For anyone who was sitting around a trading desk at the time, we’re told that it was the scariest day of their careers. That being said, look at a simple historical chart of the S&P 500 since 1928. You can barely see the 1987 crash.
More importantly, though, remember the number 9.9% because that is what your annualized total return would have been if you had ‘bought’ the S&P 500 at the end of September 1987 before the crash and held through today. While anyone making that trade in 1987 would have felt pretty stupid pretty quickly, over the long term, even buying equities at one of the worst possibly timed points in the last 50 years would have netted you an annualized return of 9.9%. Nobody knows where the market is going in the short term, but time and time again throughout history, the long-term direction has been the same.
Start a two-week free trial to Bespoke Premium to see today’s full Morning Lineup report. You’ll receive it in your inbox each morning an hour before the open to get your trading day started.
Oct 18, 2018
Equities are looking to start the day a little lower, but futures are off their lows of the overnight session. Economic data so far this morning has been positive as the Philly Fed and both Initial and Continuing Jobless Claims all came in slightly better than estimates. The pace of earnings reports is starting to pick up, but we still haven’t seen much of an improvement to the sell the news reaction that has been in place for over a month now.
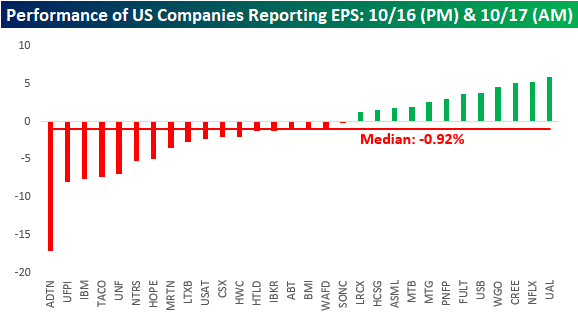
With regards to the earnings sell the news trend, we would note that of the 30 US companies that reported earnings from the close on Tuesday through the open on Wednesday, only 12 finished higher yesterday. Overall, the median return of the 30 stocks was a decline of 0.92% compared to the S&P 500, which was flat on the day. The way the market has been punishing stocks that report earnings of late, there hasn’t been any incentive to buy a company ahead of its earnings report.
Start a two-week free trial to Bespoke Premium to see today’s full Morning Lineup report. You’ll receive it in your inbox each morning an hour before the open to get your trading day started.
Oct 17, 2018
Just like that, is everything all better with the market? While it may seem that way after yesterday’s big gain, there’s not much follow-through today as futures are lower. The only pocket of strength is in the Nasdaq where futures are indicated modestly higher on the heels of strong earnings results from Netflix (NFLX). Housing Starts and Building Permits were just released, and both came in modestly weaker than forecast.
Yesterday really was a pretty impressive day in terms of market breadth as the S&P 500’s A/D line was the strongest since March. More impressive, was the fact that every component of the Dow Industrials, Transports, and Utilities indices traded higher on the day. That type of breadth is something we haven’t seen since the Monday before the 2016 Presidential election! Years ago before ETFs started to dominate the market, that type event where every Dow Industrial, Transport, and Utility component traded higher on the day, was pretty monumental in the market.
Nowadays, though, it isn’t quite as impressive a feat. As shown in the chart below, there have been over 50 prior occurrences since the lows of the financial crisis in March 2009. Looking at where they occurred in various stages of the market shows no clear pattern of similar moves indicating a notable trough or peak.

Start a two-week free trial to Bespoke Premium to see today’s full Morning Lineup report. You’ll receive it in your inbox each morning an hour before the open to get your trading day started.
Oct 16, 2018
US equity futures are attempting to rally again this morning after yesterday’s last hour decline of nearly 1% erased all the positive goodwill from the rebound earlier in the day. The pace of earnings reports is finally starting to pick up, and based on this morning’s results, at least, the news has been good. Of the 12 companies that have reported, 11 have exceeded EPS forecasts and just three missed revenue estimates. The big question now is, can stocks finally rally on what at the surface look like good results?
Looking ahead at market seasonal trends, the gauges below are from our Stock Seasonality tool and show the S&P 500’s median historical return over the upcoming week, month, and quarter during the last ten years. In that span, the upcoming week and month have seen median gains of 0.48% and 1.18%, respectively. Relative to all other one week and one month periods over the last ten years, these returns are pretty much in line with the norm. Looking out over the next three months, though, it doesn’t get much better than the S&P 500’s median gain of 6.11% which ranks right up there with the best three month periods of the calendar over the last decade.

Start a two-week free trial to Bespoke Premium to see today’s full Morning Lineup report. You’ll receive it in your inbox each morning an hour before the open to get your trading day started.
Oct 15, 2018
We’ve seen a valiant effort by the bulls to bring US equity futures back into the black after some moderate declines earlier this morning, but the just-released September Retail Sales report isn’t helping matters as the headline reading came in weaker than expected (+0.1% act vs +0.6% exp). Ex Autos, the September reading was even weaker showing a decline of 0.1%, which was the weakest monthly reading since May 2017.
As we enter a new trading week, we just wanted to provide a brief synopsis of where stocks in various sectors and market cap ranges stand relative to their 52-week highs. The table below shows the percentage of stocks in each sector (grouped by market cap) that are down 10% and 20% from their 52-week highs. For the S&P 500 as a whole, 69% of stocks are down an at least 10% from their highs, while 30% are down over 20%. The numbers for small caps are even worse with 86.6% down more than 10% and over half down 20%+.

Start a two-week free trial to Bespoke Premium to see today’s full Morning Lineup report. You’ll receive it in your inbox each morning an hour before the open to get your trading day started.