Nov 28, 2025
See what’s driving market performance around the world in today’s Morning Lineup. Bespoke’s Morning Lineup is the best way to start your trading day. Read it now by starting a two-week trial to Bespoke Premium. CLICK HERE to learn more and start your trial.
“Scientific knowledge advances haltingly and is stimulated by contention and doubt.” – Claude Lévi-Strauss

Below is a snippet of commentary from today’s Morning Lineup. Start a two-week trial to Bespoke Premium to view the full report.
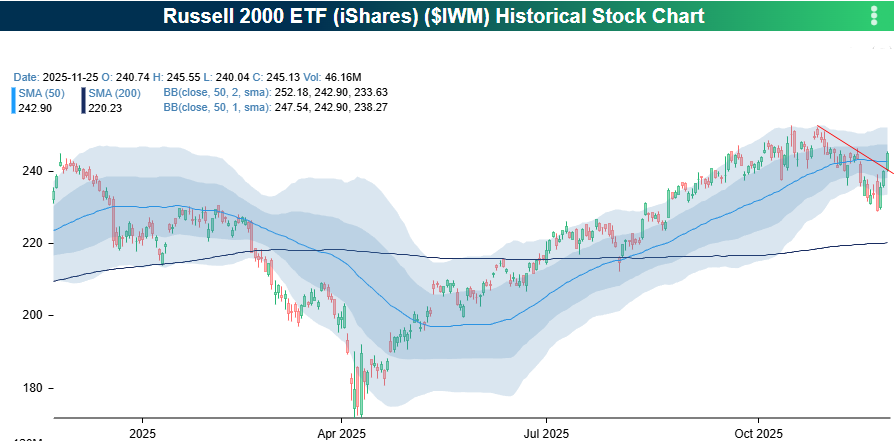
Hope everyone in the States had a great Thanksgiving! Futures are halted this morning following a technical glitch on the CME, but equity ETFs tracking the S&P 500 and Nasdaq are indicated to open up 0.34% and 0.51% respectively, on this holiday-shortened day. Small caps are also higher with the Russell 2000 poised to open up 0.33%, although that won’t even be enough to erase the declines seen in the final half hour of trading on Wednesday. Treasury yields are little changed relative to Wednesday’s close, while crude oil and gold are both up about 0.60%. Even Bitcoin isn’t doing much this morning as it hovers just above $91K, although that’s a big improvement from the $86K level it was at on Wednesday afternoon.
Today may not seem like an important day, with many people taking the day off and the market open for only 3.5 hours, but it is coming down to the wire on the S&P 500’s six-month winning streak. Heading into today, the S&P 500 is down 0.40%, which is only slightly more than SPY’s current pre-market gain. So grab your popcorn, and don’t hit the mall just yet!
In most Asian markets, trading activity to close out the week was generally positive, adding to an already positive week. The one exception was South Korea, where the KOSPI fell 1.5%, taking its YTD gain down to just below 2% on the week. In Japan, CPI came in at 2.8% y/y, which was slightly higher than expected. Despite that increase, a BoJ policymaker contended that underlying inflation remains below their 2% target.
In Europe, trading is very quiet so far this morning, with the STOXX 600 up 0.1%, but the index and the individual country benchmarks that underly it are all firmly in positive territory for the week. French CPI data for November unexpectedly declined 0.1% versus expectations for an unchanged reading.
From a market perspective, there was a lot to be thankful for yesterday, especially given where it stood at various points in the year. As we head into the last day of the penultimate month of 2025, we wanted to take a quick look at how the S&P 500 has historically performed on the final trading day of November and the first trading day of December.
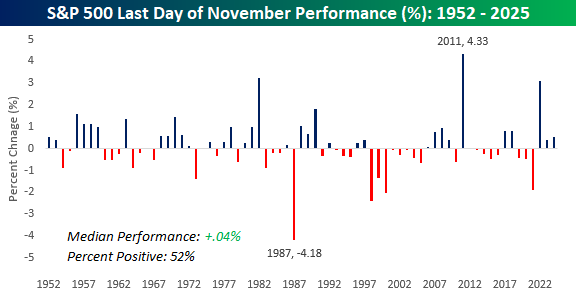
Earlier this week, we showed how Black Friday has historically been a positive day for stocks, with the S&P 500 averaging a one-day gain of 0.24%. However, Black Friday isn’t usually the last trading day of the month, and market performance hasn’t been particularly strong on that day. Since the five-trading-day week in its current form began in late 1952, the S&P 500’s median performance on the last trading day of the month has been a gain of 0.04% with positive returns 52% of the time.
The worst year was in 1987, when the market was still reeling from the October crash, and the S&P 500 fell 4.18% while the best day was in 2011 – another volatile year – when the S&P 500 rallied 4.33%. 2022 was the third-best performance for the last day of November when the S&P 500 saw a nice gain of 3.09% in the early weeks of the bull market. That also happened to be the exact day that ChatGPT came into our lives!
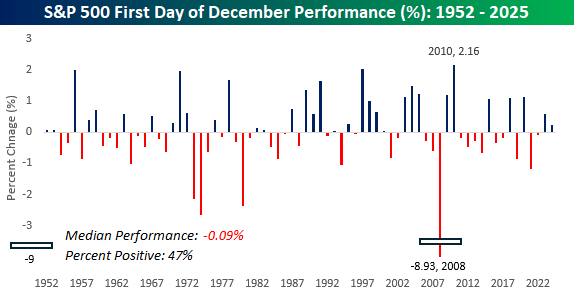
The first trading day of December has also been as bland as an overcooked turkey with no gravy. Since 1952, the S&P 500’s average performance on the first trading day of the month has been a decline of 0.09% with positive returns just 47% of the time. The best performance was a gain of 2.16% in 2010, while the worst was a year earlier in 2008, when the S&P 500 plunged 8.93%. 8.93%! Think about that for a second. We didn’t even fall that much in the latest market pullback (at least not yet), and some people were already acting like it was the end of the world, but in 2008, the S&P 500 fell that much in a single day!
If you’ve been around the block a few times, it may sound hard to believe, but there are now people with driver’s licenses and/or who are applying to college that were born after Lehman Brothers filed for bankruptcy in 2008. Time has a way of dulling memories, especially the bad ones, so for both people who weren’t around during the Financial Crisis and those who were (and just may not have been paying attention), it’s easy to forget how crazy that time was.
That 8.93% decline on the first trading day of December wasn’t just an outlier. In November 2008, the S&P 500 had a daily move of +/-5% on eight of the month’s 19 trading days, and in the three months after Lehman’s bankruptcy, there were 18. That’s more than once every four days!
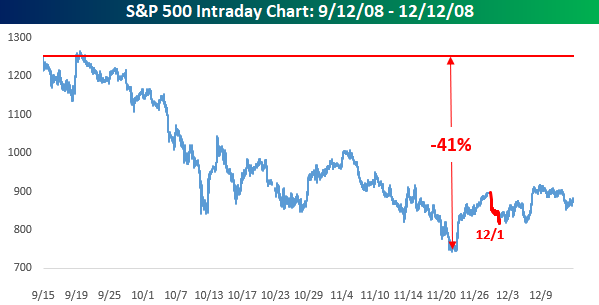
A better way to show this, though, is to look at an intraday chart of the S&P 500 in the three months following Lehman’s bankruptcy. On the Friday before Lehman went belly up, the S&P 500 closed at 1,251.70. Besides a brief period in the following days, it didn’t reach that level again for a few years, and by Thanksgiving, just over two months later, more than 40% of the S&P 500’s market value was vaporized. Also, you almost need to squint to see it, but that red ‘scratch’ on the right of the November low represents the 8.93% one-day decline from 12/1/08. In the markets, just like life, everything is relative.
Nov 26, 2025
See what’s driving market performance around the world in today’s Morning Lineup. Bespoke’s Morning Lineup is the best way to start your trading day. Read it now by starting a two-week trial to Bespoke Premium. CLICK HERE to learn more and start your trial.
“Stop worrying about the world ending today. It’s already tomorrow in Australia.” – Charles Schulz
Below is a snippet of commentary from today’s Morning Lineup. Start a two-week trial to Bespoke Premium to view the full report.
It’s only Wednesday, but today is the last full trading day of the week, so it feels like a Friday. Futures look poised to extend the rally from last Friday into a fourth day with S&P 500 and Nasdaq futures up 0.2% after reclaiming their 50-day moving averages yesterday. The Nasdaq’s gain comes despite another 1% decline for Nvidia (NVDA), which has hit a rough patch of news in the last few days. After yesterday’s reports that Meta (META) was looking to purchase some AI chips from Alphabet (GOOGL) to diversify from NVDA, this morning, The Information is reporting that China continues to move away from NVDA chips, with the latest example being a government order blocking ByteDance from using NVDA chips in its datacenters.
Since markets are closed tomorrow, weekly jobless claims came out early this week, so after weeks of delayed reports, now we’re getting an early report! The early news was also good as both initial and continuing claims came in lower than forecast. Durable Goods and Cap Goods orders were also released and came in better than expected. Along with these reports, the Chicago PMI report for November comes out at 9:45.
Outside of equities, treasury yields are basically flat, with the 10-year yield right at 4%. Crude oil is fractionally lower again, while gold trades marginally higher, and bitcoin is lower.
Asian markets finished the mid-week session mostly higher. The lone exception was China’s Shanghai Composite, which saw a modest decline. South Korea led the region higher with a gain of 2.7% while Japan finished up 1.9%. European markets are mostly higher, with the STOXX 600 up 0.4%, but Germany is underperforming after the IMF says that the economy is likely to undershoot growth expectations given its current trajectory.
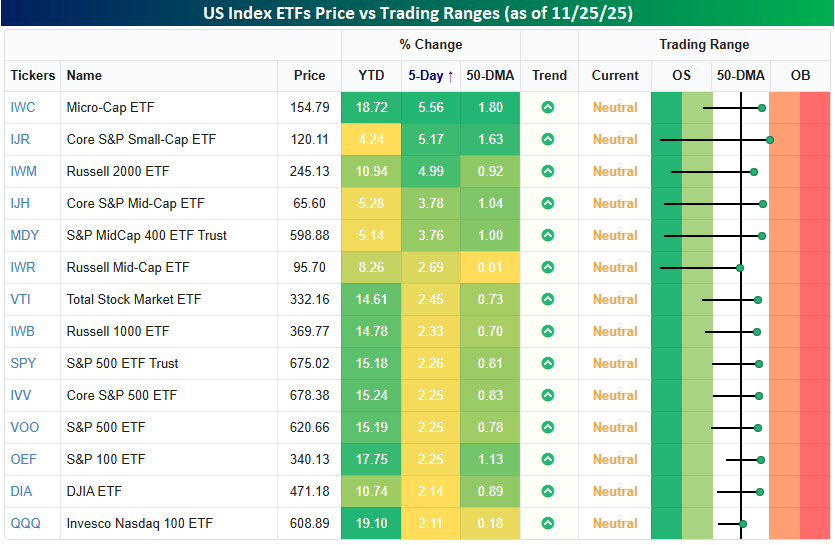
Whenever we hear the term “neutral,” we associate it with the word stuck giving it a negative connotation. There’s nothing negative about the neutral state of the major US equity indices, though, since it follows what were mostly oversold conditions last week at this time. As shown in the snapshot below, a week ago, all the index ETFs in our Trend Analyzer snapshot were below their 50-day moving averages, and most of them were oversold. As of yesterday’s close, none of them were oversold, and all of them were above their 50-DMAs. We’ll take neutral!
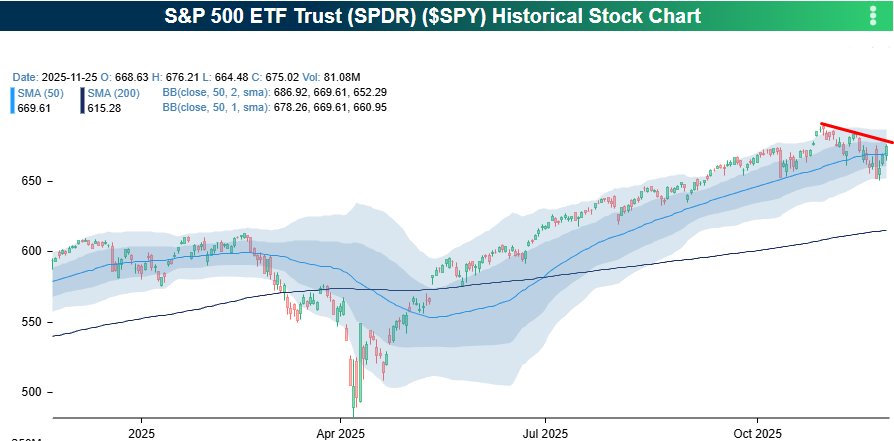
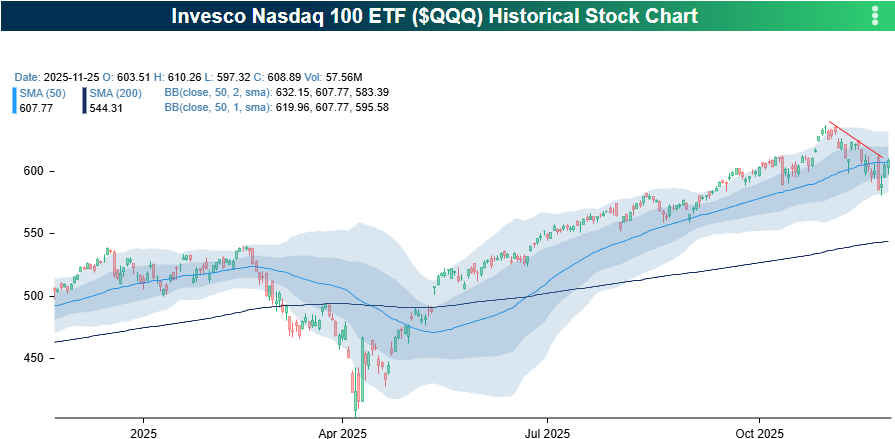
While bulls have welcomed the rebound in US equities, large-cap stocks still have more work to do before breaking the short-term downtrends that have been in place since the October highs. As shown in the two charts below, the S&P 500 ETF closed yesterday just below that downtrend line, while QQQ tested that downtrend yesterday and even peeked above it, depending on how hard you squint.
As the snapshot above illustrates, small-cap stocks have led the rally over the last five trading days with gains of about 5% compared to gains of about half that for their large-cap peers. With that outperformance, the Russell 2000 broke its downtrend from the October highs. Is this the long-awaited broadening we’ve all been waiting for?
Nov 25, 2025
See what’s driving market performance around the world in today’s Morning Lineup. Bespoke’s Morning Lineup is the best way to start your trading day. Read it now by starting a two-week trial to Bespoke Premium. CLICK HERE to learn more and start your trial.
“You have put me in here a cub, but I will come out roaring like a lion, and I will make all hell howl!” – Carrie Nation
Below is a snippet of commentary from today’s Morning Lineup. Start a two-week trial to Bespoke Premium to view the full report.
It’s an eventful morning in markets, but futures are little changed on all the cross-currents with the S&P 500 indicated to open up less than 0.10% while the Nasdaq is indicated to open down less than 0.10%. While futures on the Nasdaq are little changed, it comes are the index’s largest component – Nvidia (NVDA) – is down 5% while its third-largest component – Alphabet (GOOGL) – is up 4%.
Crude oil is down over 1% on reports of a truce in the Russia-Ukraine war while gold is up over 1%, and Bitcoin is down 2%. In Asia, major benchmarks were modestly higher, even as Softbank fell 10% as that stock corrects hard as investors question some of its massive and concentrated AI investments. In Europe, the tone is also muted with the STOXX 600 up 0.2%.
We also got some government economic data this morning, although it was from September, so it’s as stale as the bread you may be using for your Thanksgiving stuffing. Overall. the Retail Sales report for September was modestly weaker than expected while PPI was also slightly weaker.
It’s up again?
It’s up again!
When it comes to Alphabet (GOOGL), whether you identify with the phrasing above that uses the question mark or the exclamation point depends on whether you own it or not. We’ve seen a lot of unbelievable moves in mega-cap stocks in the last few years, but the recent surge in GOOGL ranks right up there with any of the others. Following news reports this morning that Meta Platforms (META) is considering the purchase of Google TPU chips for its data centers in 2027, the stock is up another 4% this morning which would take its one week gain to 16.7%. After trading as low as $140 back in April, the stock is up over 135%.
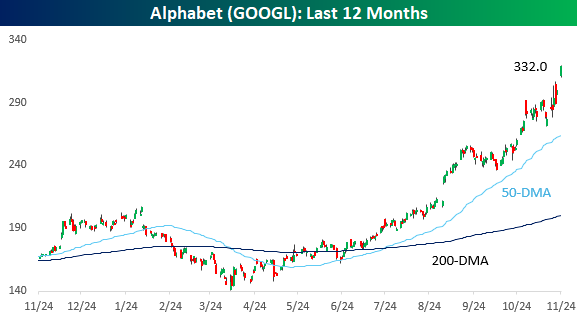
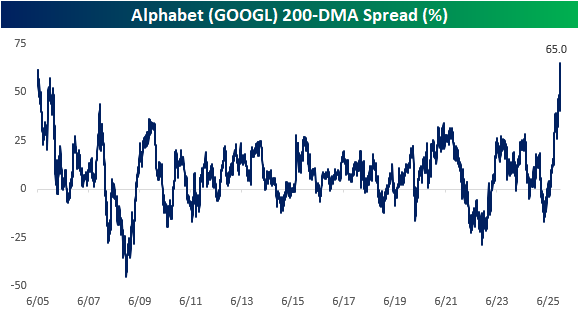
With the steep rally we have seen in GOOGL shares over the last few months, the stock is poised to trade 65% above its 200-DMA today. In the company’s entire history as a public company, that would be the most extended the stock has ever traded relative to its 200-DMA.
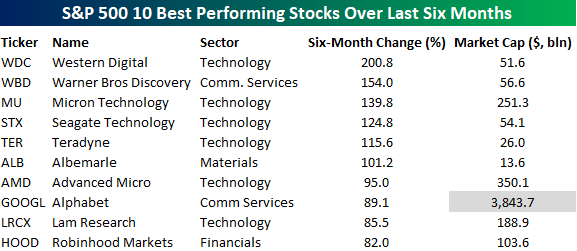
Besides the 135% rally off the April lows, over the last six months, GOOGL shares have rallied nearly 90%. The table below lists the ten largest gainers in the S&P 500 over the last six months, and GOOGL currently ranks eighth. In another sign that Tech and Communication Services still rule this market, the only two stocks on the list not from these sectors were Albemarle (ALB) and Robinhood (HOOD). What makes GOOGL stand out from the rest of the names is its market cap. At $3.8 trillion through yesterday’s close, GOOGL’s market cap is more than ten times larger than the next closest stock listed. It’s like an aircraft carrier sprinting with a fleet of skiffs.
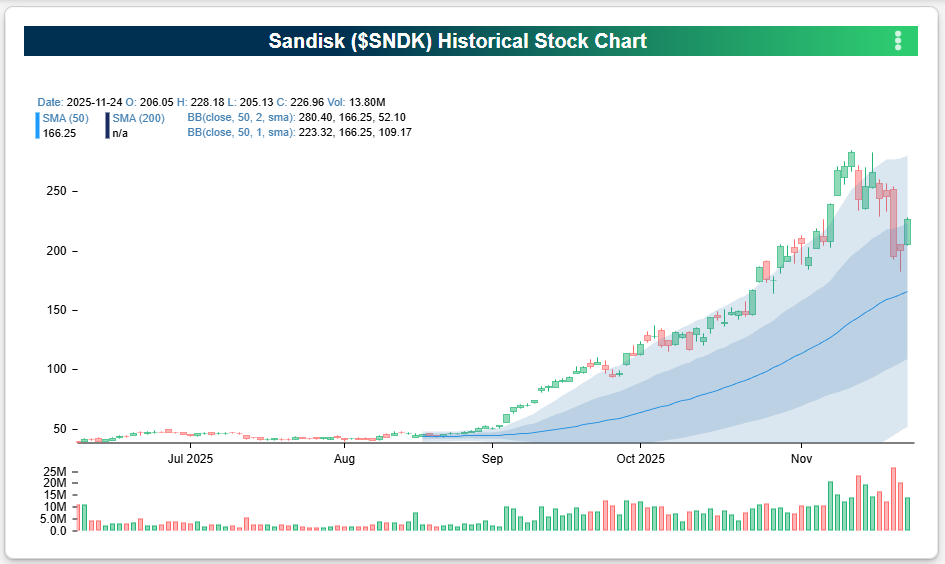
Last night after the close, news hit the tape that Sandisk (SNDK) would be added to the S&P 500 effective Friday (11/28). With the stock up nearly 500% over the last six months, the list of current top performers over the last six months is eating its dust. Looking at the chart below, it’s hard to imagine why, from a market timing perspective, anyone would think that now is a good time to add the stock to an index.
The people who make the decisions to add and subtract stocks to the various indices aren’t market timers, though. And while there are plenty of other stocks out there that would make worthy candidates, SNDK currently resides in the S&P 600 Small Cap Index. With a market cap of over $33 billion, though, it’s hardly a small cap, and it casts a large shadow over all the other stocks in the index in terms of size. After SNDK, the next largest stock in the S&P 600 is SPX Technologies (SPXC), but its market cap is less than a third of SNDK’s market cap. So, why not put it in the S&P 400 Mid Cap Index, you may ask. That would have been an option, but even in that index, SNDK would have already been the largest company in the index based on market cap. Even in the S&P 500, SNDK will still be larger than 228 of the index’s 500 components. Sometimes stocks become so large that there’s just nowhere else to put them!

Nov 24, 2025
See what’s driving market performance around the world in today’s Morning Lineup. Bespoke’s Morning Lineup is the best way to start your trading day. Read it now by starting a two-week trial to Bespoke Premium. CLICK HERE to learn more and start your trial.
“No man becomes rich unless he enriches others.” – Andrew Carnegie
Below is a snippet of commentary from today’s Morning Lineup. Start a two-week trial to Bespoke Premium to view the full report.
Following a Friday rebound on the back of comments from NY Fed President John Williams that he was open to a rate cut at the December meeting, the week is starting on a positive note. S&P 500 futures have rallied 0.5% while Nasdaq futures point to a gain of 0.76% as shares of Alphabet (GOOGL) trade up another 3% following comments from Marc Benioff saying how much better Gemini 3 is than ChatGPT and that he’s ‘not going back’.
Japanese stocks were closed for a holiday, but Hong Kong stocks surged 2% while South Korean stocks declined modestly in what was a generally quiet session to start the week. European stocks are generally off to a quiet start this week as well. The STOXX is basically unchanged, while Germany (0.5%) leads and Italy (-1.0%) lags. One major weakness in the region, though, is the defense sector, as a potential end to fighting in the Ukraine war has that sector selling off. In terms of data, it’s been quiet. The only report was German Business confidence from ifo, which showed an unexpected decline from October, falling from 88.4 to 88.1 versus forecasts for an uptick to 88.6.
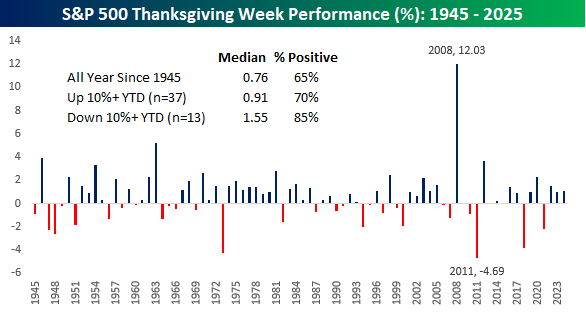
With the market only open for trading three-and-a-half days this week, it’s one of the shortest trading weeks of the year. With many on Wall Street usually taking Friday off, it’s only a three-day work week for many. It may be short, but Thanksgiving week has historically been strong. Since 1945, the S&P 500’s median performance during the week has been a gain of 0.76% with gains 65% of the time.
This year is the 38th time since 1945 that the S&P 500 was up by double-digit percentages heading into the week, and in the 37 prior years, the S&P 500’s median gain for Thanksgiving week was even stronger at 0.91% with positive returns 70% of the time. There have also been 13 years when the S&P 500 was down by double-digit percentages heading into Thanksgiving week. While you wouldn’t expect that investors would have had much to be thankful for in those years, the S&P 500’s median gain during the holiday week was a gain of 1.55% with positive returns 85% of the time.
As shown in the chart below, recent Thanksgiving week performance have also been positive. In the last three years, the S&P 500 rallied more than 1% in each Thanksgiving week, and it’s been positive during this week in eleven out of the last 13 years.
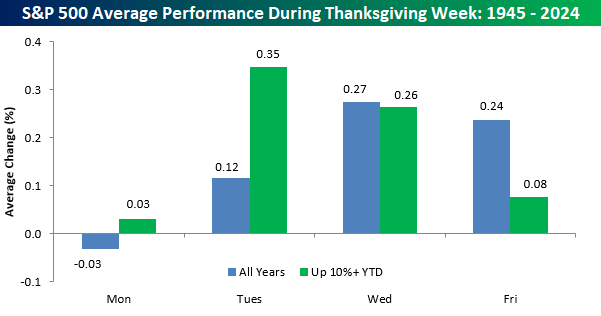
Looking at day-to-day returns, the chart below shows the S&P 500’s average performance during each day of Thanksgiving week for all years since 1945 and years when the S&P 500 was up 10%+ YTD. For all years since 1945, the strongest days of the week have been Wednesday and Friday (maybe you want to reconsider taking Friday off!), but in years when the S&P 500 was already up by double-digits, Tuesday and Wednesday were the best days of the week. One constant trend for Thanksgiving week? Monday was the weakest in terms of performance for all years and just years when the S&P 500 was already up 10%. What would you expect for a Monday?
Nov 21, 2025
See what’s driving market performance around the world in today’s Morning Lineup. Bespoke’s Morning Lineup is the best way to start your trading day. Read it now by starting a two-week trial to Bespoke Premium. CLICK HERE to learn more and start your trial.
“To expect the unexpected shows a thoroughly modern intellect.” – Oscar Wilde
Below is a snippet of commentary from today’s Morning Lineup. Start a two-week trial to Bespoke Premium to view the full report.
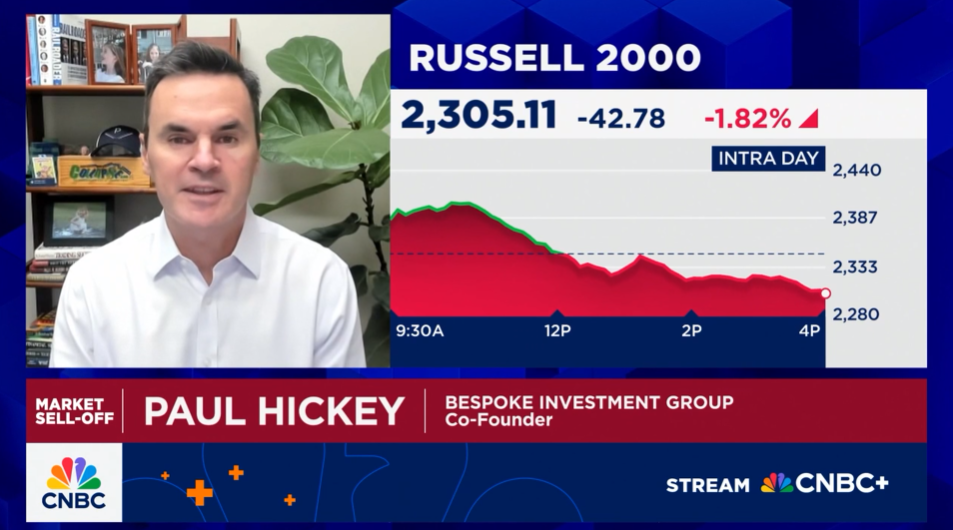
To view yesterday’s CNBC segment discussing yesterday’s sell-off and Nasdaq 5% pullbacks, in general, click on the image below.
After trading lower overnight, equity futures are higher across the board this morning following comments from New York Fed President John Williams, who says the Fed has room to lower rates in the short-term as weakness in the labor market poses a bigger risk than inflation. In response, S&P 500 futures are up 0.5% while Nasdaq futures are up slightly less. For both indices, the rebound is nowhere near enough to make up for yesterday’s declines, let alone getting us anywhere near the intraday highs from less than 24 hours ago.
Crude oil and 10-year yields are both lower, gold is basically flat, and crypto is seeing steep losses with Bitcoin and Ether both down about 4% while less ‘blue-chip’ coins in the space are down even more.
After yesterday’s weakness, it should come as no surprise that Asian stocks were creamed overnight, putting them all deep in the red for the week. European stocks are also lower, but not by the same degree, as the STOXX 600 is down 0.8%, but all major indices on the continent are on pace for weekly losses of at least 2%.
What started out yesterday as a Dr. Jekyll moment yesterday quickly turned into a Mr. Hyde event as the S&P 500, led by tech, turned a gain of nearly 2% into a decline of over 1.5%. Bulls started off the day strutting their stuff, got a little nervous as they headed out to lunch, and then came back ready to throw up.
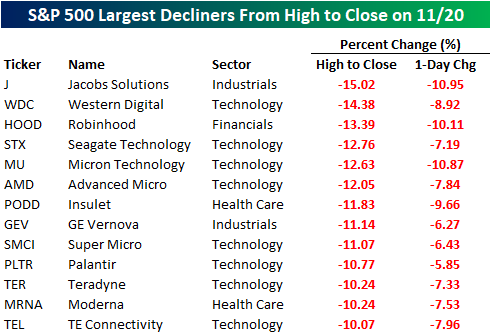
Within the S&P 500, there were some major reversals. 13 stocks in the index closed more than 10% lower than their intraday high, which is nearly unheard of for large-cap stocks unless there’s a stock-specific event causing the move. Looking at the list of the biggest intraday reversals, not only were eight of them from the Technology sector, but most of the ones that aren’t were still AI-adjacent stocks.
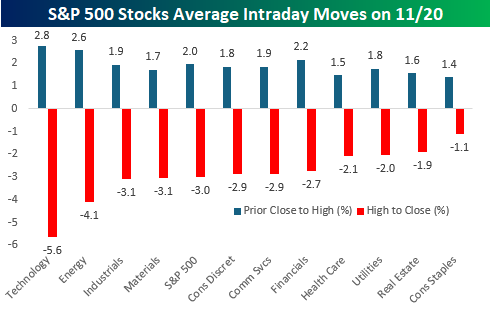
While tech led the reversal, it wasn’t solely about Tech. Within the S&P 500, 420 stocks traded down from the open to close, and the average stock in the S&P 500 finished the day down more than 3% from its intraday high. The chart below shows the average change of individual stocks yesterday from Wednesday’s close through the intraday high and then the intraday high to the close.
Tech stocks rallied the most initially, with an average gain of 2.8% and then reversed an average of 5.6% from the open to close. Besides Technology, though, the only two sectors where the average decline from the intraday high to the close was less than 2% were Consumer Staples (-1.1%) and Real Estate (-1.9%). In three sectors besides Technology (Energy, Industrials, and Materials), the average decline was more than 3%. So, again, Tech led the way but it had plenty of company.
Nov 20, 2025
See what’s driving market performance around the world in today’s Morning Lineup. Bespoke’s Morning Lineup is the best way to start your trading day. Read it now by starting a two-week trial to Bespoke Premium. CLICK HERE to learn more and start your trial.
“Great ideas come from everywhere if you just listen and look for them. You never know who’s going to have a great idea.” – Sam Walton
Below is a snippet of commentary from today’s Morning Lineup. Start a two-week trial to Bespoke Premium to view the full report.
Strong results from Nvidia (NVDA) have pushed global markets higher. The stock is trading up over 5% in the pre-market, and as a result, S&P 500 and Nasdaq futures are both trading more than 1% higher. Even Russell 2000 futures, which have no exposure to NVDA, are up over 1%. Heck, the Dow is even trading higher!
International markets were also higher overnight in Asia and this morning, with gains of mostly 1% or more. Treasury yields are basically unchanged, crude oil is back to $60 per barrel, gold is flat, and crypto assets are up at least 3%.
We’re finally getting some economic data this morning, and the main report was the September Non-Farm Payrolls report, which showed 119K jobs created versus forecasts for an increase of 50K. Despite the larger-than-expected increase, the Unemployment Rate ticked up to 4.4% versus estimates of 4.3%. More timely data on jobless claims came in at a relatively benign 220K.
In his last press conference following the Federal Reserve’s October meeting on 10/29, Fed Chair Powell made comments regarding the consumer, noting that “Data available prior to the shutdown show that growth in economic activity may be on a somewhat firmer trajectory than expected, primarily reflecting stronger consumer spending.” He then went on to simply state, “Consumers are still spending.”
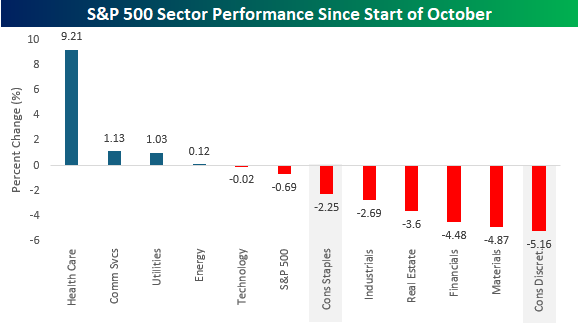
Based on data that the Federal Reserve has, consumer activity still looks strong, but the stock market seems to be sending a different message. The chart below shows YTD sector performance, and while the S&P 500 is still up close to 13% on the year, the Consumer Discretionary sector is the worst performer, and Consumer Staples is tied for the second worst. Both sectors are also two of just three sectors down on the year.
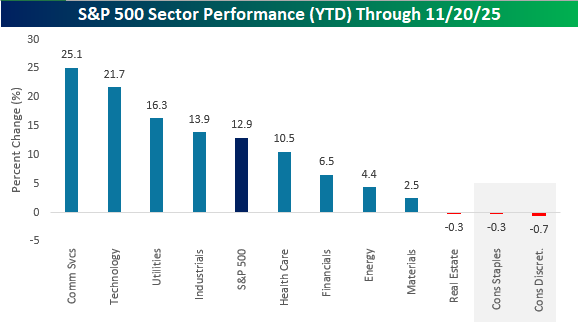
While neither consumer sector was a market leader at any point this year, both sectors have seen significant underperformance since the start of October, when the government shutdown started. While only four sectors are higher, Consumer Staples is down three times more than the S&P 500, and Consumer Discretionary is the worst-performing sector with a decline of 5.2%.