Feb 9, 2026
See what’s driving market performance around the world in today’s Morning Lineup. Bespoke’s Morning Lineup is the best way to start your trading day. Read it now by starting a two-week trial to Bespoke Premium. CLICK HERE to learn more and start your trial.
“All the measures of the Government are directed to the purpose of making the rich richer and the poor poorer.” – William Henry Harrison

Below is a snippet of commentary from today’s Morning Lineup. Start a two-week trial to Bespoke Premium to view the full report.
Paul Hickey will be appearing on Investopedia’s Express Live today at 10:00 AM Eastern. You can view the segment on YouTube or LinkedIn.
Whether it’s staying up late watching the Super Bowl last night or too much excitement from Friday’s rally that took the DJIA above 50K for the first time, US equity futures are subdued to kick off the week. The S&P 500 is on pace for a decline of 0.15% at the open, while the Nasdaq is down twice as much. Down, but nothing major.
Outside of equities, yields are higher with the 10-year yield up 4 bps to just under 4.25%. Crude oil is modestly higher, erasing earlier losses, while gold has bounced back above $5K per ounce and silver rallies 4% to get back above $80 per ounce. Crypto had a respite from selling on Friday and moved back above $70,000, but the bounce hasn’t lasted long. This morning, we’re not only back below $70K but barely hanging onto $69K.
There’s not a lot on the data calendar today, but we will hear from a few Fed officials. More importantly, December Retail Sales will be released tomorrow, the January Non-Farm Payrolls report will hit the tapes on Wednesday, and then on Friday, we’ll get CPI for January.
Asian markets took the cue from Dow 50K on Friday and kept the rally going to kick off the week. The Nikkei surged almost 4%, while South Korea rallied just over 4%. Snap elections in Japan were positive for PM Takaichi, giving her party a supermajority, which should pave the way for her to implement her high-spending growth agenda.
In Europe, the tone isn’t quite as exuberant this morning, but stocks are broadly higher. The STOXX 600 is up 0.3%, and the UK is the only major benchmark facing losses. The February Investor Confidence survey from Sentix came in higher than expected as it unexpectedly moved into positive territory.
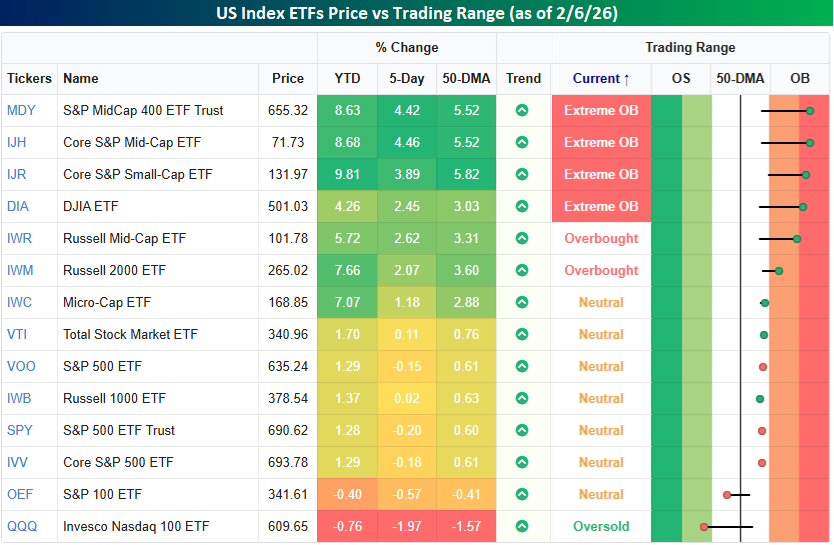
The diverging performance of small and large-cap stocks continued last week. The most overbought US index ETFs to close out the week are all generally smaller-cap and non-tech focused, while anything associated with mega-caps was down. In a week when the Dow (DIA) was up over 2% and closed at an all-time high, the Nasdaq 100 (QQQ), S&P 100 (OEF), and even the S&P 500 (SPY) were all lower. The Nasdaq 100’s 2% decline moves that index not only below its 50-DMA but also into oversold territory. At the other extreme, smaller and mid-cap indices, along with the Dow, are at various degrees of overbought levels.
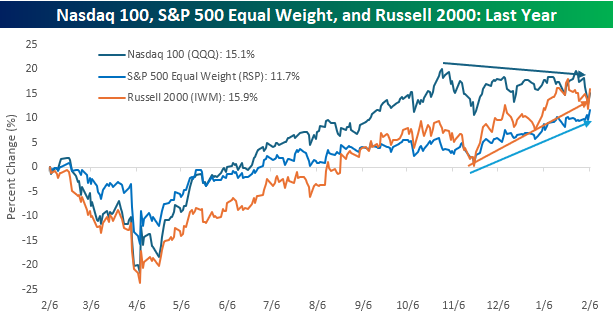
Looking at the performance of the Nasdaq 100, S&P 500 Equal Weight (RSP), and the Russell 2000 (IWM) ETFs over the last year shows an interesting shift. Since its peak last October, the Nasdaq 100 has been drifting lower while both the S&P 500 Equal Weight and Russell 2000 have rallied. The result is that the Russell 2000 is now outperforming the Nasdaq 100 over the last year, and the S&P 500 Equal Weight Index is rapidly closing the gap.
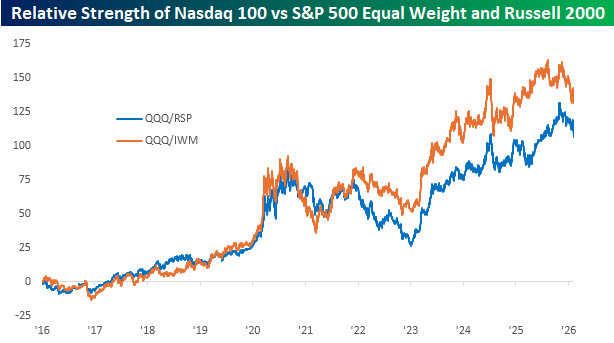
It’s been a rough three to four months for the mega-cap stocks relative to the rest of the market, but from a longer-term perspective, the recent underperformance of QQQ relative to RSP and IWM looks like much more benign as the longer-term trend remains intact. Whether that means this is just a temporary setback or that there’s much more mean reversion left in store remains to be seen, but for investors riding the mega-cap rally for the last several years are hanging on with white knuckles, hoping that, like the presidency of William Henry Harrison, this is a short stint.
Feb 6, 2026
See what’s driving market performance around the world in today’s Morning Lineup. Bespoke’s Morning Lineup is the best way to start your trading day. Read it now by starting a two-week trial to Bespoke Premium. CLICK HERE to learn more and start your trial.
“I have wondered at times what the Ten Commandments would have looked like if Moses had run them through the US Congress.” – Ronald Reagan
Below is a snippet of commentary from today’s Morning Lineup. Start a two-week trial to Bespoke Premium to view the full report.
It’s been a rough week for bulls, but they’re trying to end the week on a positive note. Let’s just see if they have enough firepower to keep the market up through the trading day. The S&P 500 and Nasdaq are both on pace to open up by about 0.50%, even with Amazon.com (AMZN) trading down 7.5%. Even with the gains, treasury yields are down modestly, with the 10-year yield at 4.2%, so there’s still a good amount of trepidation out there.
Crude oil is also down fractionally, with WTI trading down to $63. The precious metals stocks have been surprisingly calm this morning, at least relatively speaking. Gold is up 0.7% while silver and platinum are both down about 3%. And hold onto your hats for a second, Bitcoin is trading higher! After touching $60K overnight, Bitcoin is up 5% to just above $66K.
In Asia overnight, the Nikkei traded up 0.8% and finished the week up 1.8%, but every other major index in the region finished down for the week, and except India, they were also all down on Friday. The weakness in Asia hasn’t followed through to Europe, though. The STOXX 600 is up 0.4%, which will keep it in positive territory for the week.
In the US today, the only economic reports on the calendar are Michigan Sentiment at 10 AM (who knows how they’ll be feeling this month) and then Consumer Credit at 3 PM.
It’s well established that the trillion-dollar market cap stocks no longer trade as a monolith to the upside, but unfortunately for bulls, it looks increasingly like they trade in unison to the downside. On a YTD basis, there’s plenty of dispersion in performance. Among the group’s worst performers, we’re less than a week into February, but Microsoft (MSFT), Tesla (TSLA), and Broadcom (AVGO) are all down over 10% YTD. Another two stocks – Nvidia (NVDA) and Amazon.com (AMZN) are down YTD (AMZN will be down over 10% at the open this morning). On the upside, the gains aren’t nearly as large as the losses, but Wal-Mart (WMT) has managed to gain close to 14% while Alphabet (GOOGL) managed to hang on to a gain of over 5% after yesterday’s intraday bounce.
Over the last five trading days, the trillion-dollar stocks have traded more in tandem. Seven of the ten listed are down over the last week, and most are down over 5%. At the other extreme, the gainers have also moved over 5%, so it’s mostly been an either-or situation for the group, with most stocks taking the “or” path.
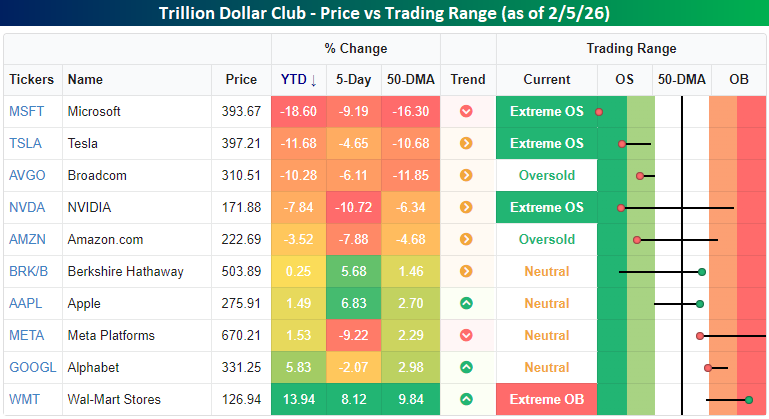
As mentioned above, GOOGL was on pace for a much larger decline yesterday, following its incredible boost to CapEx guidance on Wednesday. Shortly after the open, the stock was down over 8% and well below its 50-DMA, but buyers stepped in throughout the trading day, and the stock finished down less than 1% and outperformed all of the major US equity indices in the process. Yes, GOOGL was actually a positive (or less negative) contributor to yesterday’s market performance!
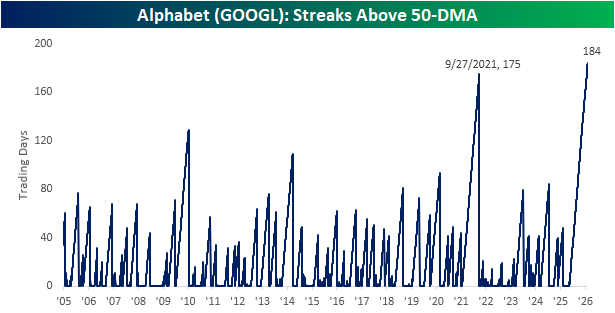
With GOOGL rallying throughout the day, it also extended its record streak of closes above its 50-DMA. At 184 trading days, GOOGL hasn’t traded below its 50-DMA since May 1st! Before the current streak, the prior record of closes above the 50-DMA ended at 175 trading days in September 2021.
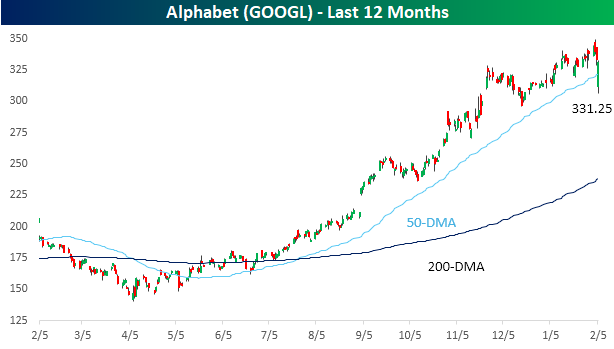
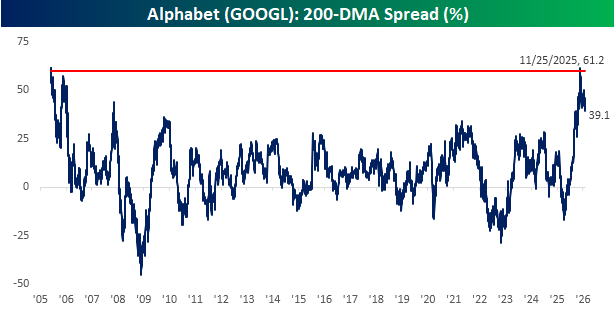
What you’ll also notice looking at GOOGL’s price chart is how much space there is between the stock’s price and its 200-DMA. As of yesterday’s close, GOOGL was 39.1% above its 200-DMA, which is among the highest readings on record, Even more incredible is that in late November, it was more than 60% above its 200-DMA, which was right up there with the record high spread of 61.7% from way back in June 2005, less than a year after the stock’s IPO.
It’s a stunning reversal from just a year ago, when the stock languished well below its 200-DMA and investors criticized the company for “missing AI”. Headlines suggested an existential crisis. Clearly, the market has made up for lost time.
Feb 5, 2026
See what’s driving market performance around the world in today’s Morning Lineup. Bespoke’s Morning Lineup is the best way to start your trading day. Read it now by starting a two-week trial to Bespoke Premium. CLICK HERE to learn more and start your trial.
“The best way to keep something bad from happening is to see it ahead of time… and you can’t see it if you refuse to face the possibility.” – William S. Burroughs
Below is a snippet of commentary from today’s Morning Lineup. Start a two-week trial to Bespoke Premium to view the full report.
US equity futures have been weakening all morning. As we approach the open, the S&P 500 is on pace to open down by more than 0.5% while the Nasdaq is down 0.75% as a 3% decline in shares of Alphabet (GOOGL) drags down the tech sector, even though the 50% increase in its CapEx plans should be a boost for the AI infrastructure trade.
With weaker equities, treasuries are catching a bid, and the 10-year yield is back down near 4.25%. Energy prices are significantly lower, with WTI down over 2% and below $64 per barrel. Volatility is even greater in the precious metals space as gold falls more than 1%, and silver is down over 10%. While strength in the precious metals never seems to give crypto an excuse to rally, today’s weakness has Bitcoin and Ethereum both down over 5% as the former is now below 70K.
In Asia last night, most major averages were lower on the session as the Nikkei declined 0.9% while South Korea’s KOSPI plunged 3.9%. The only index in the region to trade higher was the Hang Seng with a gain of 0.1%. There were no Asia-specific catalysts for the decline, as the weakness was more related to the overall tech sector fatigue.
European equities may not have as much exposure to tech, but they’re weaker across the board in early trading. The STOXX 600 is down 0.4% as Spanish equities lead the losses with a decline of 1.2%. Retail Sales in the Eurozone fell 0.5%, which was more than the 0.2% expected decline, and defense contractor Rheinmetall gave weak guidance.
Tuesday’s JOLTS report and Friday’s Non Farm Payrolls report have been delayed due to the shutdown, but jobless claims hit the tape at 8:30, and initial claims came in significantly higher than expected at 231K versus estimates for 210K. Continuing claims, though, were slightly lower than expected. On the earnings front, we also have another busy afternoon in store, headlined by Amazon.com (AMZN) after the close.
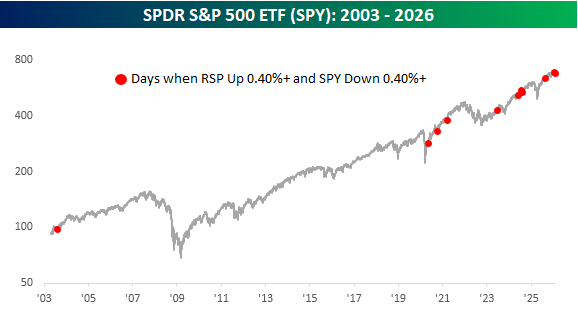
It’s only happened 11 times in the last 20+ years, but in the last three weeks, we’ve seen it occur twice. What is it? Yesterday, the SPDR S&P 500 ETF (SPY) fell 0.48% while the Invesco S&P 500 Equal Weight ETF (RSP) rallied 0.87%. That was just the 11th time since RSP’s inception in 2003 that SPY fell more than 0.4% while RSP rallied more than 0.4% on the same day. The most recent occurrence was in mid-January, and most have been in the last five years, as the top-heavy nature of the market has intensified, making disparities like yesterday less of an anomaly.
The chart below shows each occurrence on a chart of SPY. While it happened once in 2003, every other occurrence came after the Covid crash in 2020.
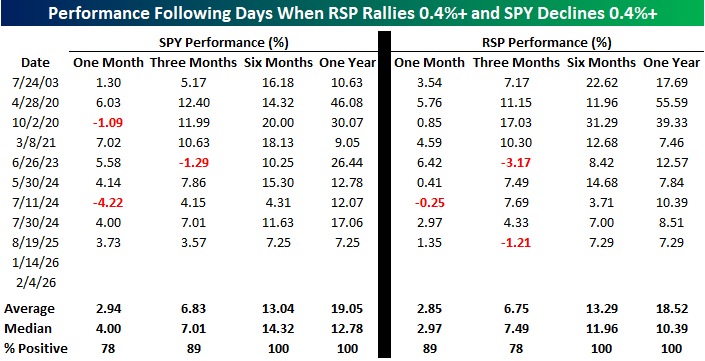
In the past, these types of performance disparities between the market cap and equal weight S&P 500 ETFs have been accompanied by ominous forecasts, suggesting that if the biggest stocks in the market were under pressure they would drag down everything else. The table below shows the opposite, though. Three months after the nine prior occurrences before this year, SPY was higher eight out of nine times, and RSP was up seven out of nine times. Six and twelve months later, they were both higher every time. We’re not sure how either ETF will trade in the months ahead, but past divergences like yesterday have been anything but an ominous pattern.
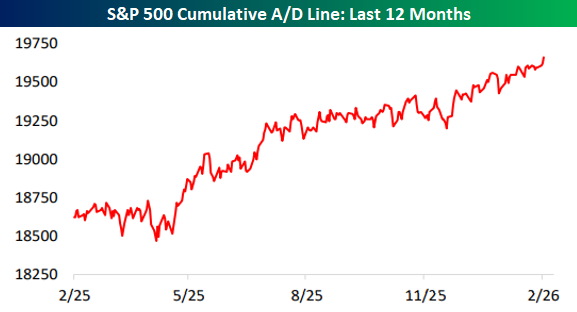
With RSP outperforming SPY yesterday, you can guess that breadth was positive, and that helped to push the S&P 500’s cumulative advance/decline line to a new all-time high. Certain heavily weighted sectors of the market have been under pressure recently, but overall breadth has been very strong.
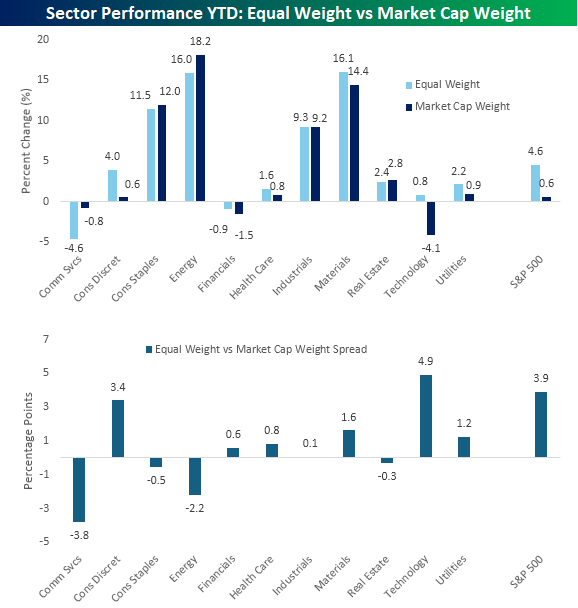
The trend of equal-weight outperforming market-cap weight this year hasn’t just been applicable at the index level. As shown below, the equal-weight version of seven different sectors are outperforming their market-cap weighted peers on a YTD basis. The biggest equal-weight outperformers have been Technology and Consumer Discretionary, while the cap-weighted versions of the Communication Services and Energy have been the biggest outperformers.
Feb 4, 2026
See what’s driving market performance around the world in today’s Morning Lineup. Bespoke’s Morning Lineup is the best way to start your trading day. Read it now by starting a two-week trial to Bespoke Premium. CLICK HERE to learn more and start your trial.
“Wherever you come near the human race there’s layers and layers of nonsense.” – Thornton Wilder, Our Town
Below is a snippet of commentary from today’s Morning Lineup. Start a two-week trial to Bespoke Premium to view the full report.
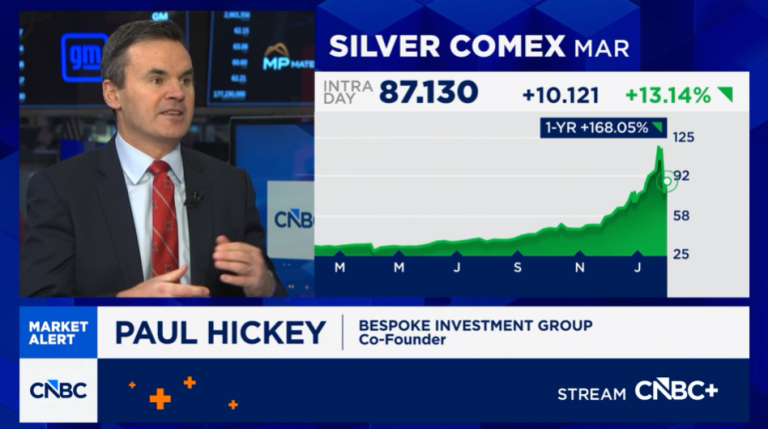
Paul Hickey appeared on CNBC’s Squawk on the Street yesterday to discuss markets and precious metals. To view part of the segment, click on the image below.
Futures are modestly higher after investors look to pick up the pieces of yesterday’s rout in certain areas of the market. The S&P 500 is indicated to open 0.20% higher, while the Nasdaq is basically unchanged. AMD is the big loser this morning with a decline of 9% after the company reported better-than-expected earnings but raised sales guidance by less than some analysts had expected.
Outside of equities, treasury yields are little changed, and energy-related commodities are fractionally higher. Precious metals have been livelier in the early going as gold rallies back above $5,000, and silver pushes towards $90 with a gain of nearly 8%. The strength in those assets is once again not translating to the crypto space as Bitcoin is flat, and other secondary coins trade lower.
On the economic calendar today, we got ADP at 8:15, which showed positive job creation but at half the pace economists had expected (22K vs 45K). The ISM Services report hits the tape at 10 AM, and following Monday’s big surge in the manufacturing sector, the market will be looking to see how broad the rebound is. There’s another busy batch of earnings after the close, but Alphabet’s (GOOGL) report will likely have the largest market impact.
Despite the weakness in the US yesterday, Asian stocks mostly rallied overnight. The Nikkei was down 0.8%, but South Korea rallied more than 1.5% as PMI data for the Services sector topped expectations. In Europe, the STOXX 600 is also up over half a percent, and Germany is the only major benchmark trading lower. Unlike in Asia, where most PMIs for the services sector were better than expected, most European readings, except for France and Italy, were weaker than expected.
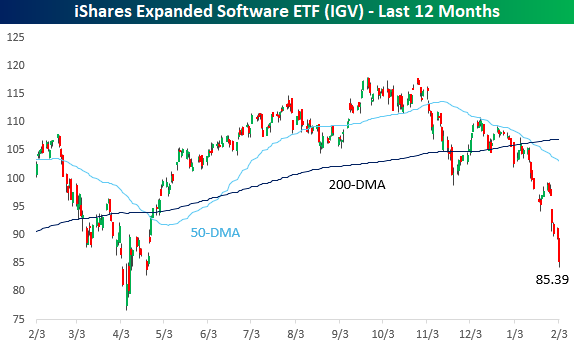
Yesterday was a rough day for the markets and especially technology, and with a decline of over 2%, it was easily the worst-performing sector on the day. Software stocks were especially hit hard as the iShares Expanded Software ETF (IGV) fell more than 4.5%, taking it down to levels not seen since the tariff-tantrum last April. Year-to-date, the ETF has already declined over 19%.
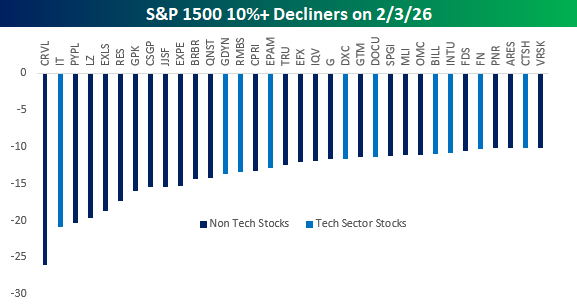
While tech stocks faced the brunt of the weakness, it was surprising to see that there weren’t more companies from the Technology sector on the list of worst performers yesterday. In the S&P 1500, 34 stocks fell more than 10%, and of those, 10 were from the Technology sector. Don’t get us wrong, ten is still a lot out of a universe of 34, but for a sell-off where attention was so focused on tech, other sectors weren’t immune. In the Industrials sector, you had stocks like Equifax (EFX), Transunion (TRU), and LegalZoom (LZ) all fall by double-digit percentages, while the Financials sector saw stocks like FactSet (FDS) and S&P Global (SPGI) experience major haircuts.
Remember, there are two sides to the growth of AI. In addition to the companies and sectors that will undoubtedly harness AI and benefit from it through increased productivity, there will also be those that have their entire business models upended and destroyed by AI. Apparently, it could happen faster than many investors think.
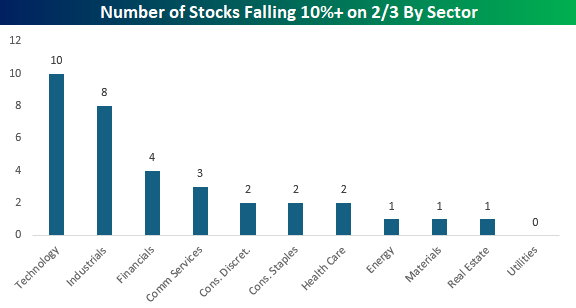
Finally, the chart below shows the sector breakdown of the 34 stocks that declined 10% or more yesterday. Tech obviously leads the list, but Industrials had eight stocks on the list, and Financials had four. In fact, the only sector not represented was Utilities.
Feb 3, 2026
See what’s driving market performance around the world in today’s Morning Lineup. Bespoke’s Morning Lineup is the best way to start your trading day. Read it now by starting a two-week trial to Bespoke Premium. CLICK HERE to learn more and start your trial.
“The way we do things is to begin.” – Horace Greeley
Below is a snippet of commentary from today’s Morning Lineup. Start a two-week trial to Bespoke Premium to view the full report.
Make sure to check out Paul Hickey on CNBC’s Squawk on the Street today at 10 AM!
Futures on the S&P 500 and Nasdaq are slightly higher this morning, as the Dow trades slightly lower. Nasdaq futures are leading the gains following a positive earnings report from Palantir (PLTR), which has the stock trading up over 10%. Treasury yields are moving higher again as the 10-year yield sits just under 4.29%, and crude oil is slightly higher. Precious metals are really in rally mode as Gold trades up over 6% and Silver is up more than twice that in percentage terms. If you were looking for things to calm down in that space, don’t hold your breath.
The only economic report on the calendar this morning is JOLTS at 10 AM, but right before that, at 9:40, Fed Governor Bowman will be speaking at a WSJ conference. On the earnings front, some of the key companies reporting after the close will be AMD, Amgen (AMGN), and Mondelez (MDLZ)
So much for that sell-off in Asian stocks to start the week. Overnight, the Nikkei surged nearly 4% to a new all-time high. Not to be outdone, the KOSPI spiked nearly 7% briefly causing another halt to trading, after Monday’s downside halt. Both Palantir’s (PLTR) positive reaction to earnings and the US India trade deal have acted as catalysts for the gains. India’s Sensex also rose over 2.5% in the wake of the trade deal, which would cut tariffs on Indian imports to 18%, and India would agree to stop buying Russian oil. All of this news overshadowed a rate hike in Australia from the RBA, which was widely expected, but the central bank did suggest tighter policy could continue as inflation accelerates.
Yesterday, it was Europe benefiting from its lack of technology exposure, but this morning, that isn’t the case. While stocks in the region are generally positive on the session, the gains are much more muted relative to Asia. The STOXX 600 is barely holding on to gains while the UK and France are both in the red.
After two weeks of sideways trading, European stocks went into lift-off mode yesterday as the STOXX 600 surged more than 1% to a new all-time high. This morning, the European benchmark index added to those gains before pulling back modestly, although it’s still up for the day. YTD, the STOXX is already up over 4%, or more than twice the 1.9% gain for the S&P 500.
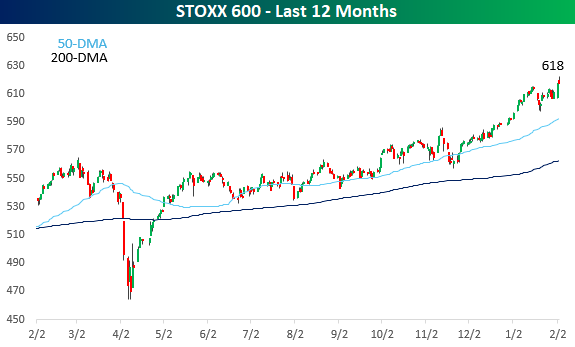
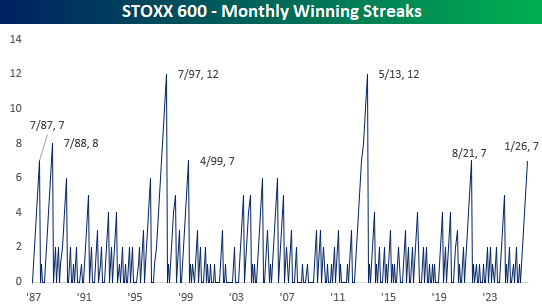
Like the Dow Jones, which has had nine months in a row of gains, the STOXX 600 has been up for seven straight months. That ranks as tied for the longest streak since May 2013 and tied for the fourth-longest on record.
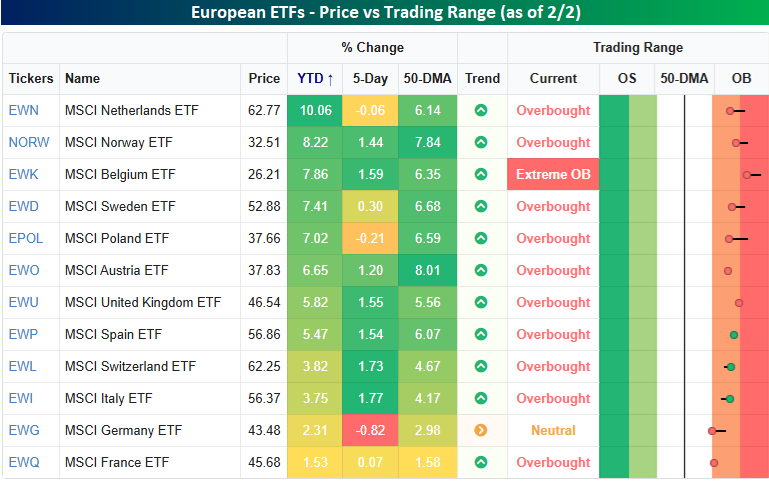
Looking at individual country performances within Europe, the snapshot below from our Trend Analyzer shows the performance of country ETFs on the continent. Of the 12 ETFs shown, all of them are up YTD, and France is the only one underperforming the S&P 500. Most of the countries have outperformed the US by a wide margin. The Netherlands (EWN) ETF is up over 10% already this year, and seven other countries have gained at least 5%. Most of the countries are also comfortably above their respective 50-day moving averages and well into short-term overbought territory. The only exception is Germany (EWG), which is also down the most over the last week (-0.82%).
It’s also interesting to note that most of the strength in European stocks this year hasn’t been coming from major economies like Germany, France, Italy, and Spain. They’re all at or near the bottom of the performance list. Instead, it’s the less talked about countries like the Netherlands, Norway, Belgium, and Sweden leading the way.
Feb 2, 2026
See what’s driving market performance around the world in today’s Morning Lineup. Bespoke’s Morning Lineup is the best way to start your trading day. Read it now by starting a two-week trial to Bespoke Premium. CLICK HERE to learn more and start your trial.
“Shut your eyes and see.” – James Joyce
Below is a snippet of commentary from today’s Morning Lineup. Start a two-week trial to Bespoke Premium to view the full report.
After a shaky end to the week and the month for US markets on Friday, things remain somewhat unsteady as we kick off the new month. S&P 500 futures indicate a 0.3% decline at the open, while the Nasdaq is priced to open down twice as much. For both indices, current levels are well off their lows so that it could have been a lot worse.
Treasury yields are slightly lower, with the 10-year yield starting the week at 4.23%. Crude oil is sharply lower, trading down close to 5% as President Trump suggested that the Iranians are looking to come to the bargaining table. In the metals space, it’s a mixed picture with gold up about 1% while silver bounces over 6%. Copper and Platinum, meanwhile, are both lower. After moves like we saw late last week in the space, though, we would expect more wild trading in the days ahead. These types of volatility spikes have a way of lasting more than a few days before things finally settle down.
It was a negative start to the week in Asia as the Nikkei fell over 1%, while Hong Kong and China both slumped by more than 2%. The big loser, though, was South Korea, where the KOSPI plunged over 5%, and trading briefly came to a halt because of circuit breakers. The weakness in that index stemmed from a weekend story in the WSJ where Nvidia CEO Jensen Huang said that the company’s investment in OpenAI will not be the $100 billion previously reported, and that has raised new concerns about the vitality of the AI trade.
Today is one of those rare days, it seems, where the lack of a vibrant technology sector in Europe is a plus. The STOXX 600 is up 0.4%, and the German DAX and Spain’s IBEX 35 each rally over 0.75%. Better-than-expected manufacturing PMIs for January have also acted as a positive catalyst.
In the US today, the only economic report on the calendar is the ISM Manufacturin,g which is projected to rebound slightly from December’s reading of 47.9. Given the surprise strength in the Chicago PMI last week, though, don’t be surprised if that report comes in hot. Outside of economic data, the first major tech report of the week will be Palantir (PLTR) after the close. As we detailed in today’s Chart of the Day, growth-oriented sectors of the market have been messy lately, so PLTR’s report could have big implications for the sector.
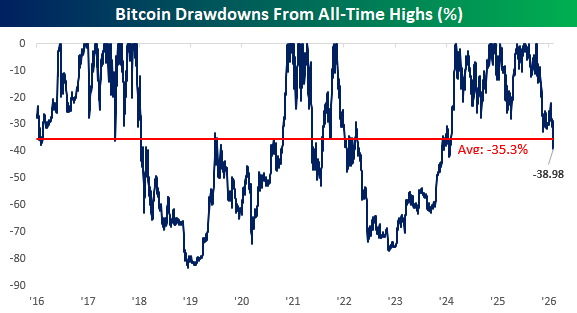
Along with growth-oriented stocks, crypto assets have been terrible performers for the last few months, and over the weekend, Bitcoin tested 52-week lows near $75K. Prices are rebounding slightly this morning along with equity futures, but the burden of proof is firmly on the back of the bulls now as Bitcoin’s price trades near the breakeven price for all of Strategy’s (MSTR) holdings.
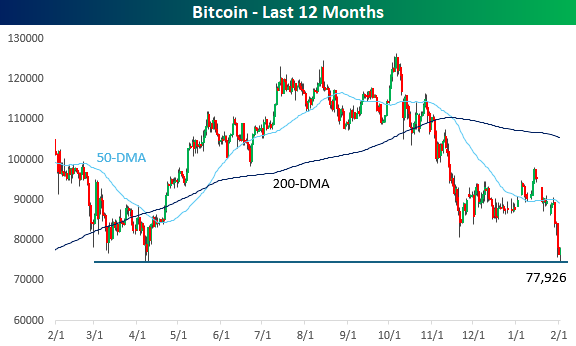
While it’s been a painful few months for crypto, it’s worth pointing out that this remains just a run-of-the-mill decline for Bitcoin. While it’s currently down about 39% from its all-time high, on any given day since 2016, its average drawdown from an all-time high has been over 35%.