Jul 16, 2026
See what’s driving market performance around the world in today’s Morning Lineup. Bespoke’s Morning Lineup is the best way to start your trading day. Read it now by starting a two-week trial to Bespoke Premium. CLICK HERE to learn more and start your trial.
“All you have to do is say something nobody understands and they’ll do practically anything you want them to.” – J.D. Salinger

Bespoke’s Paul Hickey will be appearing on Making Money With Charles Payne today at 2 PM on Fox Business. Check it out!
Below is a snippet of commentary from today’s Morning Lineup. Start a two-week trial to Bespoke Premium to view the full report.
Paul Hickey appeared on CNBC’s Squawk on the Street yesterday to discuss markets and inflation. To view the segment, click on the image below.
Futures were modestly weaker early this morning, but things have taken a turn for the worse as the morning goes on. S&P 500 futures are currently down 0.3% while the Nasdaq is indicated to open nearly 1% lower as investors question the durability of the AI trade. Treasury yields are moving higher, with the 10-year yield up 4 basis points to 4.59%, and crude oil is fractionally higher, trading right around $80 per barrel as President Trump threatens to escalate attacks on Iran. Gold and Bitcoin are both lower by about 1%.
It was a tough night in Asia as the Nikkei plunged nearly 3% and South Korea tanked over 6%. The weakness in South Korea comes as regulators look to crack down on levered ETFs, which have been driving much of the volatility on both the way up and the way down.
European stocks are also lower again this morning, with the STOXX 600 down 0.5% while Germany trades down by nearly a full percent. UK GDP came in modestly better than expected, while Industrial Production and Construction Output both dropped more than expected.
It’s a busy day for data in the US this morning, and just about all of it was better than expected. Initial and continuing jobless claims both came in slightly lower than expected, while Retail Sales were mostly in line with expectations, although May’s numbers were revised slightly higher. The real showstopper of the morning, though, was the Philly Fed report, which came in much better than expected as the headline index surged to 41.4 (highest since November 2021) versus forecasts for a reading of 12.5,
No matter how good the news gets, you can always count on skeptics to show up with a barrage of “buts”. This week’s inflation data from the June CPI and PPI reports both came in lower than expected, easing concerns over the troubling inflation levels from May’s numbers. Before investors could even digest the reports, though, you didn’t have to look far for the rebuttals. Yes, these numbers were good, they said, but with the war in Iran reigniting in the last couple of weeks, oil prices have rallied more than 15% from the early July low, so next month’s numbers will erase the improvement we saw in June.
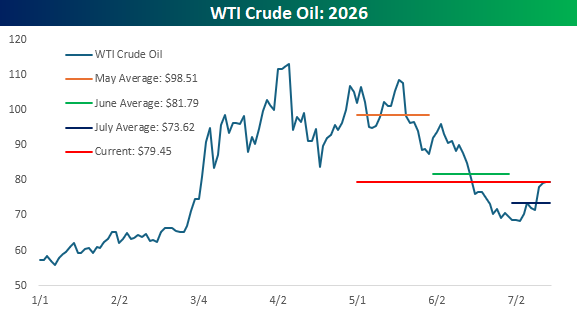
Inflation is about more than just the price of oil, but since that was the focus of the loudest of the “buts,” let’s look at the trend in prices. During May, crude oil prices averaged $98.51 per barrel. In June, which is the month this week’s data was based on, prices averaged $81.79 per barrel. This morning, after oil prices have “surged” off the July lows, WTI is trading at $79.45 per barrel. That’s still nearly 3% lower than the average price from June, and the average price of $73.62 this month is 10% less than the average price in June. If oil were the only determinant of CPI, we’d be set up for another negative print!
The point here isn’t to diminish the fact that elevated inflation is a long-term issue. We’ll be the last ones to get complacent about the market and inflation, but at current levels, oil prices don’t appear to be a threat to unwind the improvement in CPI that we saw in this week’s data. If the oil price rises back up towards $90 per barrel? Yes, that would be a problem.
Start a two-week trial to Bespoke Premium to continue reading today’s full Morning Lineup.
Jul 15, 2026
See what’s driving market performance around the world in today’s Morning Lineup. Bespoke’s Morning Lineup is the best way to start your trading day. Read it now by starting a two-week trial to Bespoke Premium. CLICK HERE to learn more and start your trial.
“We seek friendly relations with all nations. Any nation can be our friend without being any other nation’s enemy.” – Richard Nixon
Bespoke’s Paul Hickey will be appearing on Making Money With Charles Payne today at 2 PM on Fox Business. Check it out!
Below is a snippet of commentary from today’s Morning Lineup. Start a two-week trial to Bespoke Premium to view the full report.
S&P 500 futures are slightly higher this morning while the Nasdaq is slightly stronger, pointing to a gain of 0.33% as investors await the June PPI, hoping for a positive encore to yesterday’s tame CPI report. Treasury yields are moving higher, though, as the 10-year yield remains above 4.6%. In the energy market, crude oil prices are only fractionally higher despite a new round of attacks by the US on Iran. Gold is fractionally lower as it continues to hold above $4,000 per ounce, while Bitcoin quietly rallies as it moves up to $65,000.
Asian markets were mostly higher overnight, with the Nikkei rallying 1.5% while South Korea surged 6.2%. China was the outlier, falling 0.3% following a round of sluggish economic data. In Europe, stocks are lower across the board, but the losses are only fractional in nature as no major benchmark is down more than 1%. Industrial Production for the Eurozone unexpectedly declined 0.2% in May, versus expectations for an increase of 0.3%.
The data train continues to accelerate today with a busy slate of earnings results coupled with Empire Manufacturing and PPI at 8:30. Empire Manufacturing exceeded forecasts, coming in at 15.6 vs 9.2, and PPI was weaker across the board, coming in well below expectations. Headline CPI fell 0.3% m/m versus forecasts for no change, and the y/y reading dropped to 5.5% versus the 6.2% forecasts. Stripping out Food and Energy, the core reading came in at 0.2% m/m and 4.7% y/y versus expectations for increases of 0.3% and 5.1%, respectively. In reaction to the reports, futures are building modestly on their pre-market gains.
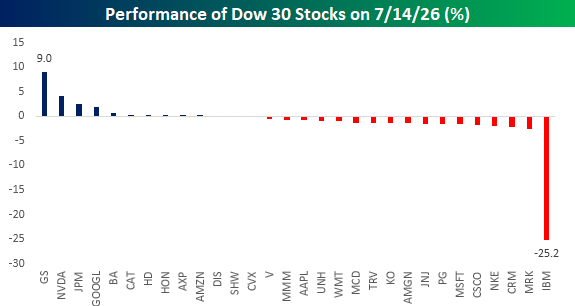
If ever there was an example of how earnings season can cause huge disparities in individual stock returns, yesterday’s performance of the Dow 30 components was Exhibit A. Fueled by better-than-expected EPS and revenue results, shares of Goldman Sachs (GS) topped the Dow performance chart yesterday with a rally of 9% and the best earnings reaction day for the stock since January 2019. While GS had one of its best earnings reaction days in years, IBM had its worst single-day performance ever with a decline of 25.2% after preannouncing weaker-than-expected results. Looking at the chart below, with yesterday’s disparate returns, the performance of the Dow 30 stocks looks more like a YTD chart than just one day.
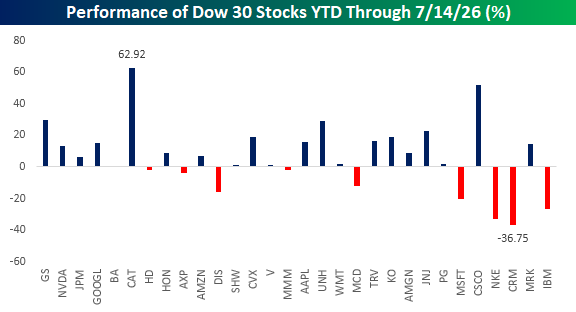
The YTD performance chart of Dow 30 stocks looks more like this. Even with yesterday’s big gains and losses, GS is not the best performing stock in the Dow YTD nor is IBM the worst performer. GS actually ranks third with a gain of just under 30%, trailing CAT and Cisco (CSCO). To the downside, IBM’s 26.7% YTD decline also ranks as the third worst performer in the index, ahead of only Salesforce (CRM), which is down 36.8% and Nike’s (NKE) decline of 32.7%.
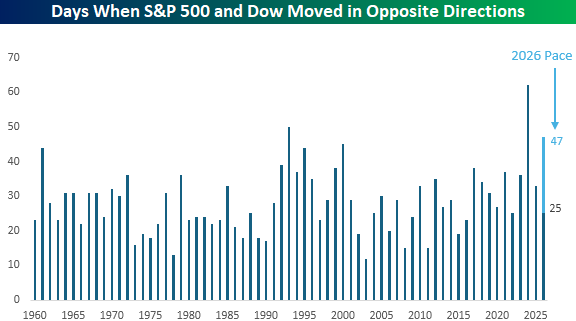
For a good part of yesterday’s session, it looked as though the S&P 500 would finish the day higher while the Dow would trade lower. The Dow managed to eke out a gain of 0.02% at the end of the day, avoiding a 26th session this year when the two indices moved in the opposite directions. The chart below shows the number of days by year when the Dow and S&P 500 moved in opposite directions. At 25 this year, 2027 is on pace for 47 diverging days between the two indices this year. If that pace keeps up, the year would finish in third for the most number of diverging days since 1960, trailing the peak of 62 in 2024 and 50 in 1993.
Start a two-week trial to Bespoke Premium to continue reading today’s full Morning Lineup.
Jul 14, 2026
See what’s driving market performance around the world in today’s Morning Lineup. Bespoke’s Morning Lineup is the best way to start your trading day. Read it now by starting a two-week trial to Bespoke Premium. CLICK HERE to learn more and start your trial.
“I don’t know as I want a lawyer to tell me what I cannot do. I hire him to tell how to do what I want to do.” – JP Morgan
Bespoke’s Paul Hickey will be appearing on Making Money With Charles Payne today at 2 PM on Fox Business. Check it out!
Below is a snippet of commentary from today’s Morning Lineup. Start a two-week trial to Bespoke Premium to view the full report.
As if the flood of earnings reports from the big banks, the June CPI report, and Congressional testimony from Kevin Warsh weren’t enough, IBM just added one more big ingredient to today’s market recipe with an earnings warning. The stock is trading down over 20% in the pre-market and on pace for its most negative opening gap in at least 50 years.
Dow futures are down 0.6% as IBM has a larger weighting in that index than the S&P 500. As a result, S&P 500 futures are down just 0.10%, while the Nasdaq 100 is on pace to open higher by over 0.50%. Whether those gains can hold into the end of the day remains to be seen.
Treasury yields continue to march higher, with the 10-year yield up to 4.62%. WTI crude oil is back above $80, while gold is fractionally higher, hanging on to $4,000, and Bitcoin is up 1%.
Equity investors in Asia licked their wounds from Monday and pushed stocks modestly higher overnight. Both the Nikkei and KOSPI were up 0.7% while onshore China was up 1.4%, and offshore stocks were up 0.5%. The 0.7% rally in South Korea looks like a modest move at the surface, but it was a volatile session with the index trading down over 5% intraday at one point.
The tone is decidedly weaker this morning in Europe as the STOXX 600 trades down 0.6%, led lower by Spain (-0.9%) and France (-0.8%), while the UK (-0.3%) and Italy (-0.4%) hold up relatively better. While equities are generally lower across the board, stocks in the region are off the intraday lows.
As mentioned above, there are a lot of catalysts for investors to navigate through today. Earnings results have been very positive, and CPI just hit the tape. The headline report came in much weaker than expected, with a decline of 0.4% versus forecasts for a decline of just 0.1%. Core CPI was unchanged versus forecasts for an increase of 0.2%. Most importantly, the year/year reading came in at 3.5% versus forecasts for 3.8%. While the May report last month created an inflation scare for the market, today’s report largely erases that. The only other report on the calendar was NFIB Small Business Sentiment, which came in higher than expected.
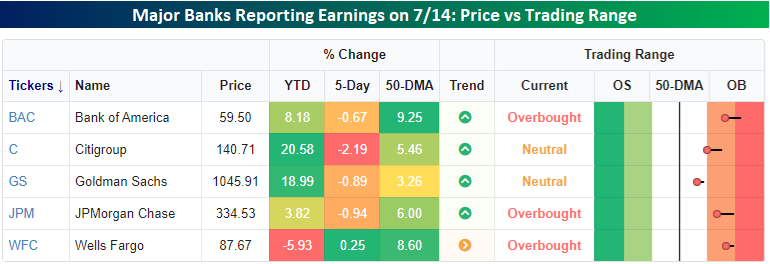
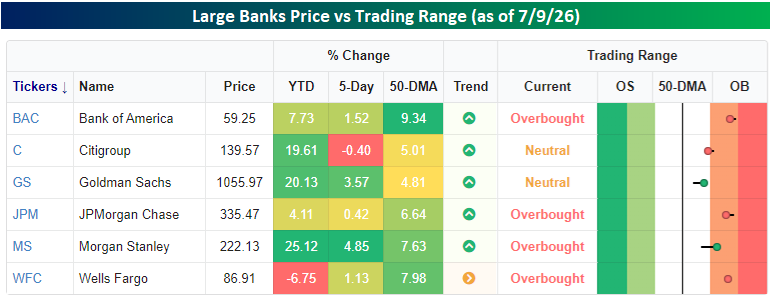
Below is a look at how the major banks and brokerage firms looked relative to their trading ranges heading into this morning’s earnings reports. The five stocks reporting are far from a monolith based on their YTD returns. While Citi (C) and Goldman Sachs (GS) are both up close to 20%, Bank of America (BAC) and JPMorgan Chase (JPM) have seen just single-digit gains, and Wells Fargo (WFC) is lower. More recently, they’ve mostly seen modest weakness, although WFC has eked out a gain. The recent weakness, it should be noted, comes after the stocks recently reached overbought levels, as they look to digest recent gains.
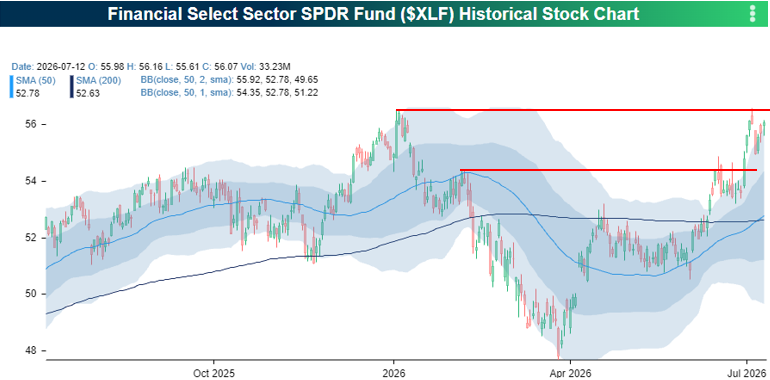
The chart below of the S&P 500 Financials sector ETF (XLF) puts the recent moves of the largest banks into perspective. After breaking above resistance about two weeks ago to the highest level of 2026, XLK reached extremely overbought levels, trading as much as three standard deviations above its 50-day moving average. It then pulled back and digested those gains after running into resistance at its prior record highs. With XLF stuck between one former and one current resistance level, how the stocks react to today’s earnings reports could say a lot about how the summer plays out for the sector.
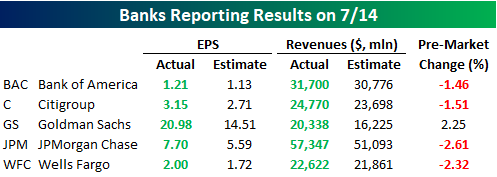
So far, the initial reaction of the stocks hasn’t been promising. All five major banks reporting this morning have easily blown out EPS and revenue forecasts, but all but GS is trading lower in the pre-market. Based on their runups into earnings season, the bar for these companies was set high.
Start a two-week trial to Bespoke Premium to continue reading today’s full Morning Lineup.
Jul 13, 2026
See what’s driving market performance around the world in today’s Morning Lineup. Bespoke’s Morning Lineup is the best way to start your trading day. Read it now by starting a two-week trial to Bespoke Premium. CLICK HERE to learn more and start your trial.
“You will never achieve success by insuring against failure.” – Patrick Stewart
Bespoke’s Paul Hickey will be appearing on Making Money With Charles Payne today at 2 PM on Fox Business. Check it out!
Below is a snippet of commentary from today’s Morning Lineup. Start a two-week trial to Bespoke Premium to view the full report.
US equity futures are red across the board to kick off the week. The Nasdaq is on pace to gap down 1% while the S&P 500 is looking at a more modest decline of 0.35%. Factors contributing to the decline include escalating tensions between the US and Iran, as well as a plunge in South Korean stocks. Treasury yields are modestly higher, with the 10-year yielding 4.59%, while WTI rallies more than 3% to $73.80. Gold is down more than 1% and just over 1% above, breaking below $4,000 per ounce, while Bitcoin is down over 2% to $62,800.
Asian stocks mostly started the week with sharp losses. The Nikkei fell 1.9%, while the Shanghai Composite dropped slightly more at 2.1%. Neither of these, though, came close to the 9% decline in South Korea’s KOSPI. The weakness came despite data showing exports surged 54% y/y, driven by a more than tripling of semiconductors. European equities aren’t seeing nearly the magnitude of weakness that Asia experienced. The STOXX 600 is down just 0.1% while most major benchmarks trade slightly higher.
There’s little in the way of data to start the week, but action will really heat up Tuesday with June CPI, Congressional testimony from Fed Chair Warsh, and most importantly, earnings results from the major banks, including Bank of America (BAC), Citi (C), Goldman (GS), JP Morgan (JPM), and Wells Fargo (WFC).
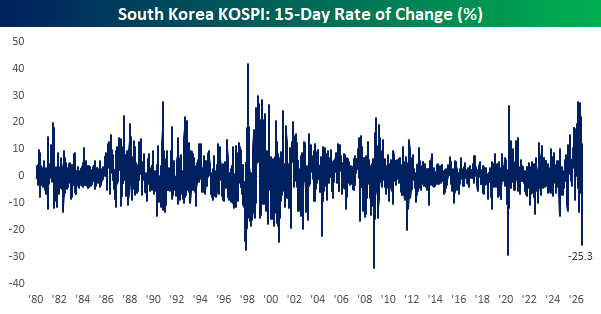
Volatility in memory stocks remains the story of the day in stock markets, and nowhere is that more on display than in South Korea’s KOSPI. The index fell nearly 9% to kick off the week as stocks like SK Hynix fell by double-digit percentages, even after Friday’s successful IPO of the company’s ADRs. Since its high three weeks ago, the KOSPI has lost more than a quarter of its value in what has been one of the largest three-week declines in the index’s history. The last time the KOSPI lost more than a quarter of its value this fast was in March 2020 during the COVID crash.
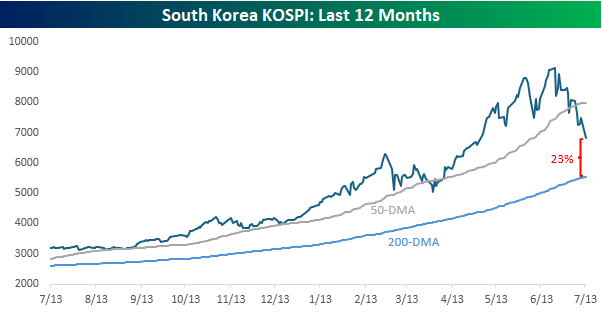
What’s amazing about this recent crash in South Korean equities is that the index is still 23% above its 200-day moving average. It’s rare to see a major international benchmark index trade well into bear market territory but still be so elevated relative to its 200-DMA.
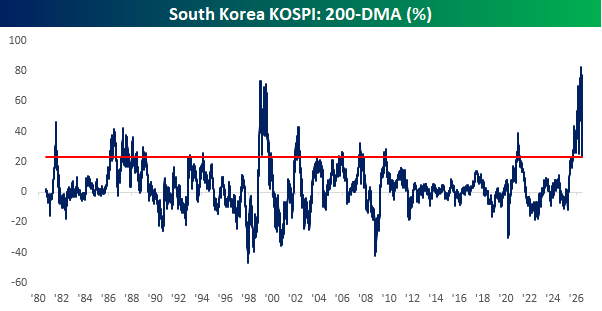
The chart below shows the KOSPI’s 200-DMA spread going back to 1980 and shows just how extended the index had become. In early June, the South Korean benchmark was more than 80% above its 200-DMA. After the recent plunge, though, the 23% spread still ranks in the 91st percentile relative to all other periods since 1980.
Start a two-week trial to Bespoke Premium to continue reading today’s full Morning Lineup.
Jul 10, 2026
See what’s driving market performance around the world in today’s Morning Lineup. Bespoke’s Morning Lineup is the best way to start your trading day. Read it now by starting a two-week trial to Bespoke Premium. CLICK HERE to learn more and start your trial.
“A well adjusted person is one who makes the same mistake twice without getting nervous.” – Alexander Hamilton
Below is a snippet of commentary from today’s Morning Lineup. Start a two-week trial to Bespoke Premium to view the full report.
With the July 4th weekend behind us, summer is in full-swing, and the season of slow summer Fridays is upon us. Futures on the S&P 500 are down less than 0.1% while Nasdaq futures point to a decline of less than 0.4%. The 10-year yield is unchanged at 4.54%, crude oil is up less than 1%, and gold is down less than 1%. The only thing really moving this morning is Bitcoin, which is up 2% to $64,400.
Asian markets were mostly positive overnight with Japan rallying 1.2% and South Korea rising 2.5%, but the gains were not enough to bring either index into the black for the week. Chinese stocks bucked the positive overnight trend, falling 1%, but that only took the weekly decline to 1.2%.
In Europe, stocks are modestly higher across the board, putting a dent into the weekly losses. Outside of Italy, which is on pace for a decline of less than 0.5%, other major benchmarks in the region are down at least 1.5% for the week.
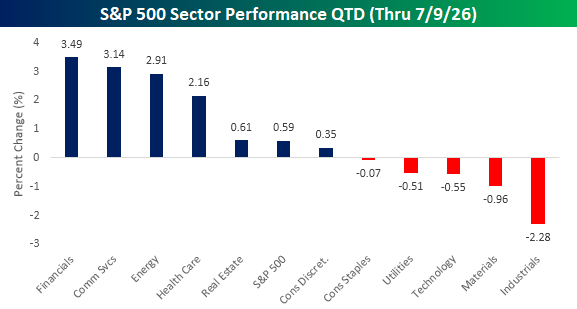
Earnings season kicks off in earnest next week as 31 companies in the S&P 500 will report earnings. Of those, 18 are from the Financials sector, and based solely on the sector’s performance to start the quarter, expectations are relatively high. With a gain of 3.49% QTD through yesterday’s close, Financials are the top performing sector this quarter, edging out Communication Services and Energy. Along with those two sectors, four other sectors have managed gains, indicating that breadth has been decent. To the downside, Industrials have been a weak spot, falling 2.28%, while Materials, Technology, and Utilities all have losses of between 0.5% and 1.0%.
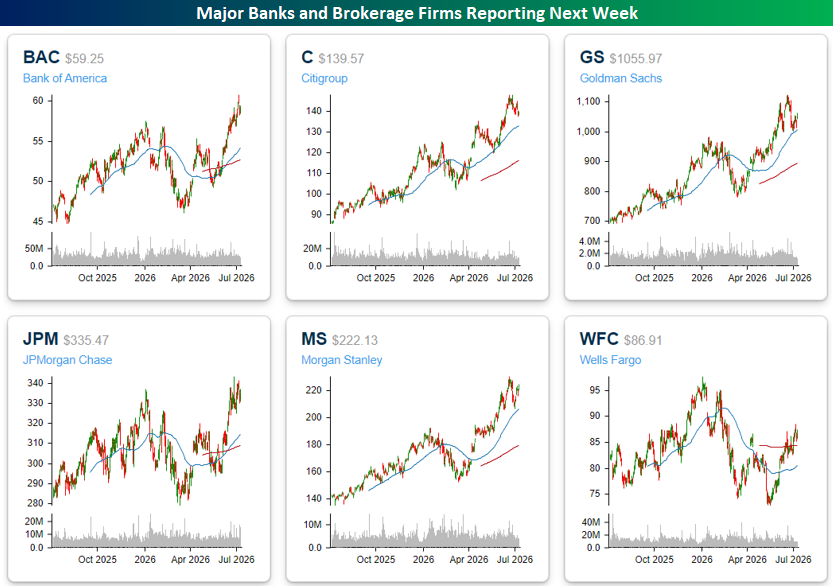
Of the Financials reporting next week, all six of the major banks and brokers will report Tuesday and Wednesday. Except for Wells Fargo (WFC), all of these stocks are up YTD with Citi (C), Goldman Sachs (GS), and Morgan Stanley (MS) all rallying roughly 20% or more.
Looking at each stocks performance over the last year shows a similar pattern where most of them have been in steady uptrends with all of them just marginally below 52-week highs. Again, the one exception is WFC which always seems to be bringing up the rear when it comes to the banks stocks.
Start a two-week trial to Bespoke Premium to continue reading today’s full Morning Lineup.
Jul 9, 2026
See what’s driving market performance around the world in today’s Morning Lineup. Bespoke’s Morning Lineup is the best way to start your trading day. Read it now by starting a two-week trial to Bespoke Premium. CLICK HERE to learn more and start your trial.
“The most successful people in the world aren’t usually the brightest. They are the ones who persevere.” – Ross Perot
Below is a snippet of commentary from today’s Morning Lineup. Start a two-week trial to Bespoke Premium to view the full report.
Even with the US launching a new round of airstrikes overnight and Iran responding with drone attacks on US bases in the Middle East, Us equity futures are mostly higher this morning with the Nasdaq rallying more than 75 bps and the S&P 500 up a more modest 0.2%. Treasury yields are little changed, while crude oil is only fractionally higher with WTI trading at just under $74 per barrel. Worried about the Middle East, the markets are not.
Asian markets were mostly higher overnight with South Korea finishing 0.6% higher. It isn’t often lately, that the index hasn’t experienced a daily move of at least 1%, so that’s noteworthy itself. Japan rallied 1.4% while Chinese stocks led the move higher with the Shanghai Composite rising 1.7% after CPI for June showed a larger than expected decline.
In Europe, most indices are seeing fractional gains. The STOXX 600 is barely higher, but Spain is more than 1% higher after President Trump softened his tone on the country in a gaggle with reporters on Air Force One last night.
In the US today, there’s not a lot of earnings news to speak of yet, although Pepsi (PEP) is lower even though the company reported better than expected EPS on inline revenues. The only reports on the economic calendar today, and the remainder of the week for that matter, are jobless claims at 8:30 and then Existing Home Sales at 10 AM.
How you feel about the market after the first few days of Q3 says a lot about how you did in the first half. If you’re starting to feel a renewed sense of optimism, you probably had a rough first half, whereas any doubts or nervousness likely means you had a great first half.
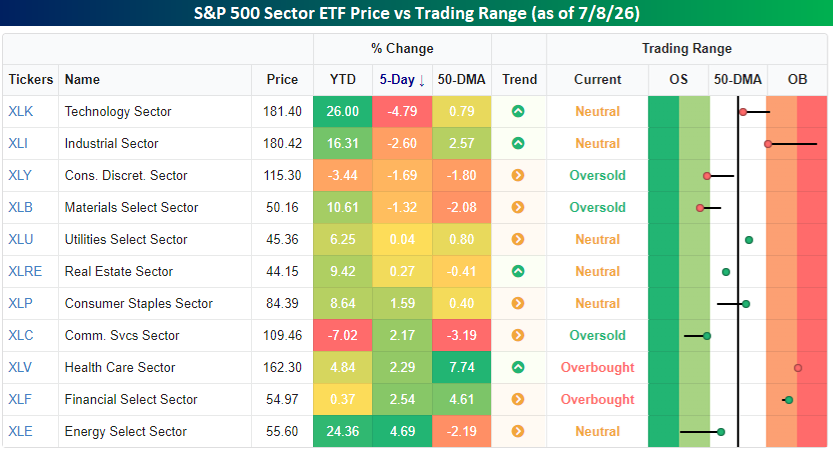
Let’s start with sector performance. The table below, a snapshot from our Trend Analyzer, shows the performance of each sector ETF on a YTD basis and over the last five trading days (the first five trading days of Q3). Three of the four worst performing sectors so far in Q3 are among the top four performing sectors YTD. The only exception is Consumer Discretionary which is the third worst performing sector QTD and the second worst performing sector YTD. At the other end of the performance spectrum for Q3, most of the top performing sectors have been laggards on a YTD basis. The only exception here is Energy. Not only is it the best performing sector on a QTD basis, but it’s also the best performer on a YTD basis.
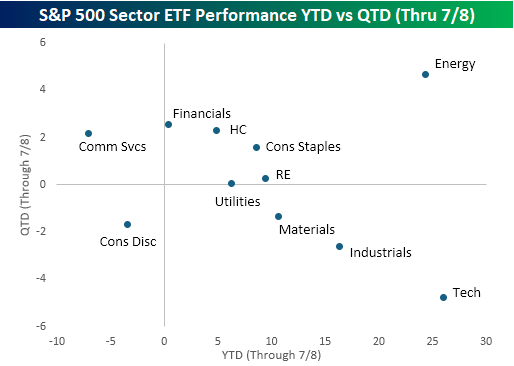
The scatter chart below provides a visual representation of this trend. With the x-axis showing YTD performance and the y-axis showing performance QTD, there is a clear trend from the top left to the bottom right. Again, the outlier here is Energy in the top right.
Start a two-week trial to Bespoke Premium to continue reading today’s full Morning Lineup.