Jun 18, 2026
See what’s driving market performance around the world in today’s Morning Lineup. Bespoke’s Morning Lineup is the best way to start your trading day. Read it now by starting a two-week trial to Bespoke Premium. CLICK HERE to learn more and start your trial.
“I don’t want to put a limit or a ceiling on what I think I can be.” – Josh Hart

Below is a snippet of commentary from today’s Morning Lineup. Start a two-week trial to Bespoke Premium to view the full report.
After markets got carried away and overreacted to new Fed Chair Kevin Warsh’s first meeting and press conference, futures are rallying this morning with tech leading the charge. Nasdaq futures are up over 1% with the S&P 500 looking to gain 0.65%. The 10-year yield is slightly lower, while crude oil falls more than 2% to $75 per barrel for WTI. Gold prices are plunging close to 3% while Bitcoin is down about 0.5% to just below $64K.
It was a mixed session in Asia as the Nikkei rallied 1.7% and South Korea surged 2.3% to a record high. At the other end of the performance spectrum, Hong Kong fell 1.6% while onshore Chinese stocks declined 0.4%. In Europe, trading is more one-sided, and it’s to the downside as the STOXX 600 is down 0.5% as it catches up with yesterday’s post-FOMC decline in the US. UK stocks are the biggest laggards, falling 1.1%, while Germany and Italy both only face modest declines of 0.2%.
In the US this morning, initial claims hit the tape at 8:30, along with the Philly Fed and then Leading Indicators at 10 AM.
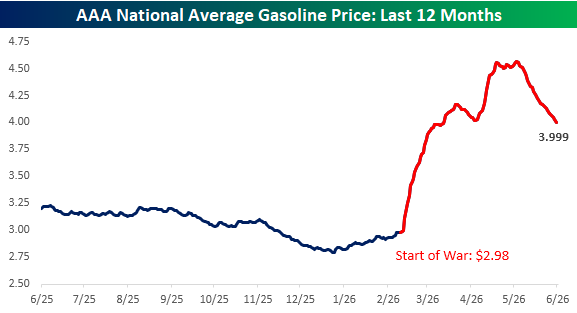
With oil prices cratering since news of a peach deal surfaced last week, gas prices have also been falling. After hitting a peak of $4.56 per gallon just before Memorial Day, the national average price, according to AAA, fell below $4 yesterday for the first time since March 29th. While those declines are welcome, the national average is still more than a dollar, or 33%, above its pre-war level of $2.98. There’s still plenty of room for improvement.
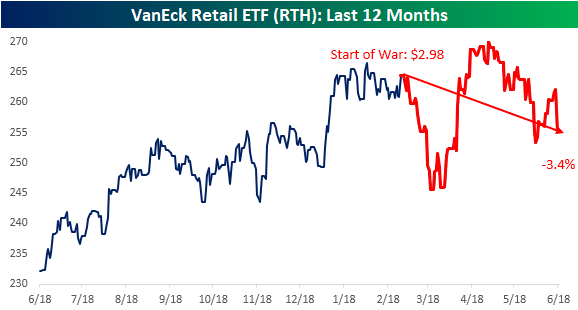
Rising prices at the pump have a big impact on consumers’ wallets, and the more they spend on gas, the less they can spend on other things. As yesterday’s Retail Sales report showed, though, retail sales have held up well despite the surge in gas prices. At first glance, retail-related stocks also appear to have hung in relatively well. Since the war started, the VanEck Retail ETF (RTH) has declined 3.4%, which doesn’t seem all that bad against a backdrop of gas prices rising by more than a third.
Start a two-week trial to Bespoke Premium to continue reading today’s full Morning Lineup.
Jun 17, 2026
See what’s driving market performance around the world in today’s Morning Lineup. Bespoke’s Morning Lineup is the best way to start your trading day. Read it now by starting a two-week trial to Bespoke Premium. CLICK HERE to learn more and start your trial.
“Reality is wrong. Dreams are for the real.” – Tupac Shakur
Below is a snippet of commentary from today’s Morning Lineup. Start a two-week trial to Bespoke Premium to view the full report.
After the Nasdaq lagged yesterday, it leads the charge in the pre-market this morning, with a gain of 0.5% while the S&P 500 looks to gain just 0.05% and the Dow is slightly lower. Treasury yields are slightly higher, while crude oil bounces 1% after a four-day decline of more than 15%. Gold and other precious metals are modestly lower while Bitcoin trades down over 1%.
Asian stocks finished mostly higher after erasing earlier losses. The only decliner in the region was Hong Kong, where the Hang Seng declined 0.8%. South Korea, however, finished 1.6% higher, while Japan traded 0.7% higher. For both countries, the closing levels were record highs. In Japan, imports rose slightly less than expected while exports came in higher, rising by 17% y/y to a three-year high.
In Europe, the STOXX 600 is up 0.4% in midday trading, with Spain leading the charge, gaining 0.5%. Germany has been a laggard after BMW lowered guidance for the year on weaker expected margins. May CPI data for the Eurozone increased 0.1% m/m, which was right in line with expectations.
Besides today’s Fed meeting, we just got Retail Sales at 8:30, which came in higher than expected (0.9% vs 0.6%). Between now and the Fed announcement, we’ll get Business Inventories and Pending Home Sales at 10 AM. The real focus, though, will be on today’s Fed meeting and the press conference at 2:30. Given that Warsh is a Trump appointee, there’s already a consensus among many that he will bend to the President’s will. If anyone involved in the markets has learned anything in their experience, though, what the consensus thinks often doesn’t play out, so let’s at least give the new Fed Chair one meeting before drawing conclusions.
Sector performance has been broadly positive over the last week, but there has been some dispersion in where each one is trading relative to its trading range. Financials (XLF) and Industrials (XLI) both finished yesterday’s session in ‘extreme’ overbought territory, while another five sectors finished in overbought territory. Trailing those sectors, Consumer Discretionary (XLY) and Utilities (XLU) finished the day in neutral territory while Communication Services (XLC) and Energy (XLE) lagged in oversold territory.
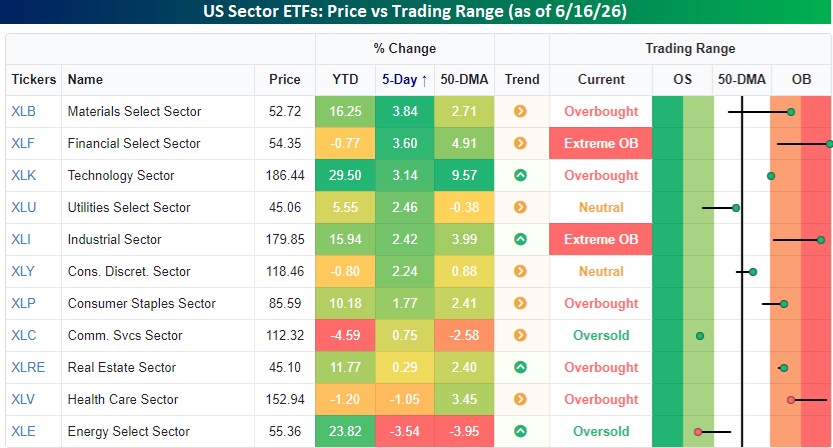
With a gain of 3.14% over the last week, the Technology sector (XLK) is one of the five sectors in overbought territory, but just barely. That strength comes despite some major weakness in the software sector. The iShares Expanded Tech-Software Sector ETF (IGV) has declined more than 1.5% over the last week, and some of the ETF’s largest components have seen big losses.
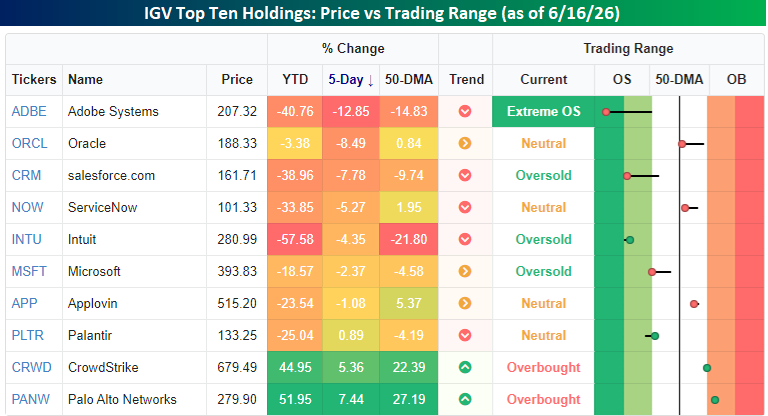
The snapshot below shows the performance of the top ten holdings in the IGV ETF. While Palo Alto (PANW) and CrowdStrike (CRWD) are both up over 5% in the last week, four other stocks are down over 5%, including Adobe (ADBE), Oracle (ORCL), and salesforce (CRM), which have all dropped more than 7.5%.
The weakness in CRM has been especially pronounced. While the stock experienced a big bounce in the late days of May into the first day of June, it’s been all downhill from there, as the stock has returned to 52-week lows.
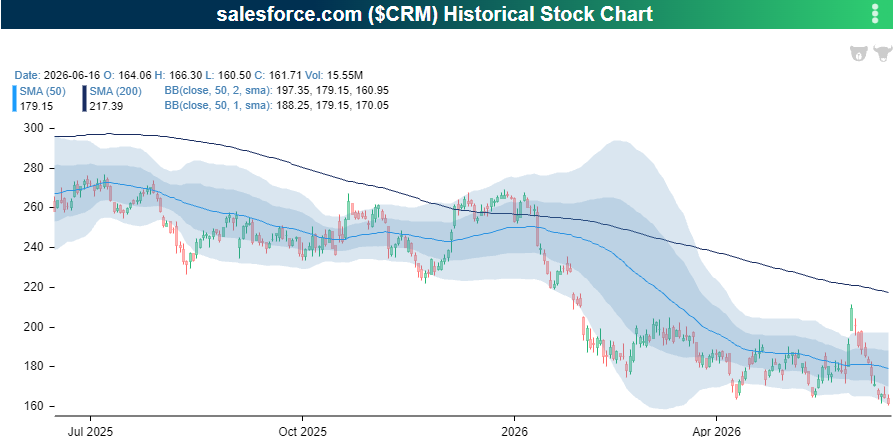
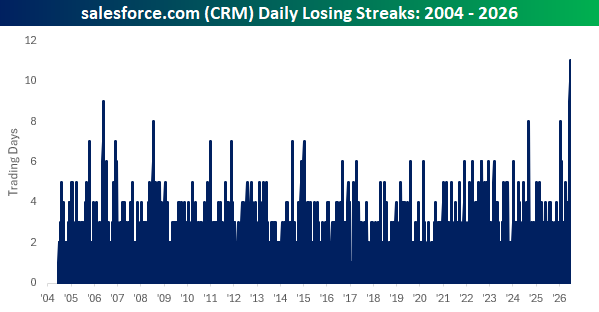
The weakness in CRM has been relentless, and the stock heads into today’s session with an 11-day losing streak. Since Marc Benioff took the company public in 2004, this is easily the longest losing streak in the company’s history.
Start a two-week trial to Bespoke Premium to continue reading today’s full Morning Lineup.
Jun 16, 2026
See what’s driving market performance around the world in today’s Morning Lineup. Bespoke’s Morning Lineup is the best way to start your trading day. Read it now by starting a two-week trial to Bespoke Premium. CLICK HERE to learn more and start your trial.
“Reality is wrong. Dreams are for the real.” – Tupac Shakur
Below is a snippet of commentary from today’s Morning Lineup. Start a two-week trial to Bespoke Premium to view the full report.
After a strong start to the week on Monday, US futures are modestly higher this morning, with S&P 500 futures indicated 5 basis points higher, while the Nasdaq looks to gain 0.15%. Treasury yields are lower, with the 10-year yield falling below 4.45%, while crude oil falls another 3.8% to under $78 per barrel for WTI. Even Brent crude oil prices are on the verge of falling below $80, and these declines all point to lower gas prices ahead of the July 4th holiday. Gold prices are slightly higher, while Bitcoin is basically unchanged at $66,500.
Asian stocks put in a mixed performance overnight. The Nikkei barely finished higher after the BoJ hiked rates 25 bps, pushing rates to 1.0% for the first time since 1995. Chinese stocks finished lower, while India (+0.7%) and South Korea (2.1%) both finished higher. The weakness in Chinese stocks came as Retail Sales fell 0.6%, which was twice the expected decline, while Industrial Production was slightly better than expected.
European stocks are broadly higher this morning, with the STOXX 600 up 0.4%. Italy is leading the way higher with a gain of 1.2%, while Spain lags. Economic sentiment, as measured by ZEW, came in higher than expected for both Germany and the entire EU region.
It’s a quiet day for economic data this morning, as the only notable reports on the calendar were Building Permits and Housing Starts for May. Building Permits came in slightly weaker than expected at 1.413 million versus forecasts for 1.418 million. The big surprise, though, was in Housing Starts, which came in much weaker than expected at 1.177 million versus forecasts for 1.430 million. That’s the smallest monthly reading since May 2020, and one of the largest misses relative to expectations that we can remember.
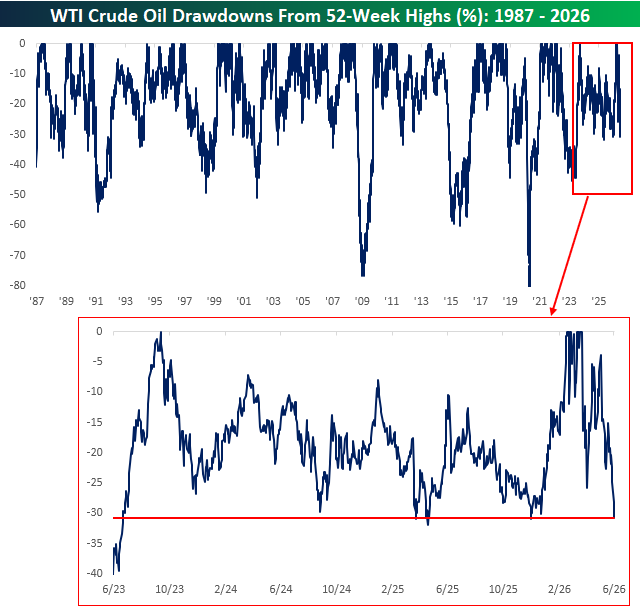
Lower oil prices have been a driver of higher stock prices over the last several days, and with crude oil trading down over 2% this morning, prices are down over 30% from their recent highs, putting the current drawdown from a 52-week high near the most extreme levels since mid-2023.
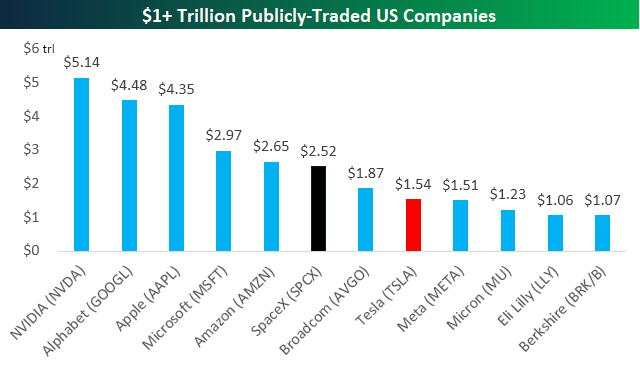
Shares of SpaceX (SPCX) are up over 5% again in the premarket but were up over 10% at one point overnight. With a market cap of $2.5 trillion as of yesterday’s close, the stock briefly had a market value in excess of Microsoft (MSFT) overnight, and it’s still right around the same levels or slightly above Amazon (AMZN). Obviously, only a small percentage of the company’s shares outstanding are available for trading, so the stock is incredibly volatile for a $2.5 trillion company, but these moves for such a large company are incredible.
Start a two-week trial to Bespoke Premium to continue reading today’s full Morning Lineup.
Jun 15, 2026
See what’s driving market performance around the world in today’s Morning Lineup. Bespoke’s Morning Lineup is the best way to start your trading day. Read it now by starting a two-week trial to Bespoke Premium. CLICK HERE to learn more and start your trial.
“There’s always one more way to do things and that’s your way, and you have a right to try it at least once.” – Waylon Jennings
Below is a snippet of commentary from today’s Morning Lineup. Start a two-week trial to Bespoke Premium to view the full report.
What looked like a questionable week for the equity market up until early Thursday afternoon quickly turned positive, and US stocks finished the week broadly higher. Of the major index ETFs we track in our Trend Analyzer, the only one to finish the week lower was the S&P 100 (OEF), which tracks the 100 largest companies in the US, and it only traded down 0.13%.
Last week’s rally was broad, with smaller-cap stocks leading the market higher. The Russell Micro-Cap ETF (IWC) traded up over 4% and finished the week in overbought territory, while the Russell 2000 (IWM) also gained 4%. Mid-cap stocks also outperformed, with the Russell Mid Cap ETF (IWR) rallying close to 2.5%. Except for the Nasdaq 100 (QQQ), other large-cap indices lagged their smaller peers, trading higher by less than 1%.
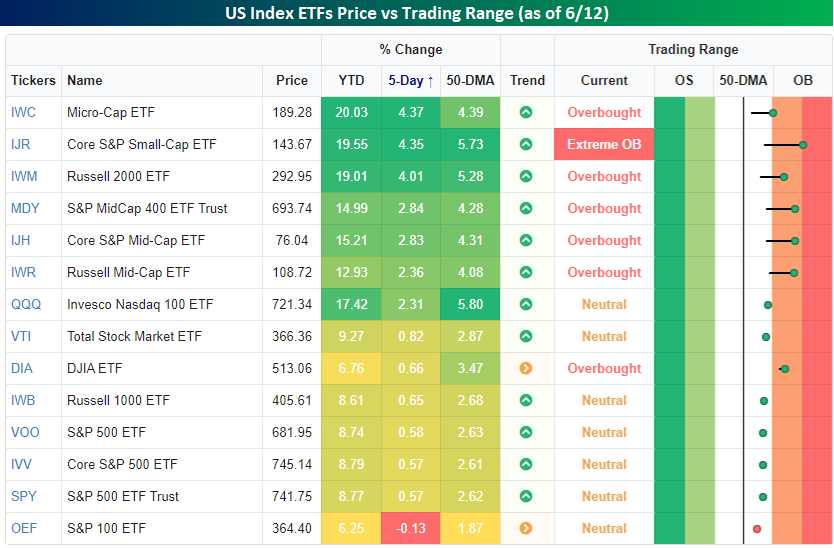
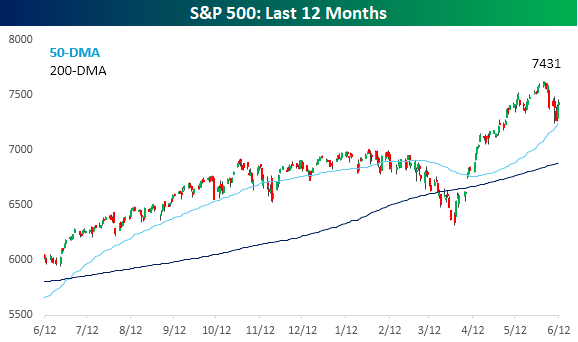
Heading into the new week, the S&P 500 is 2.5% below its all-time high, so even after today’s open, the index will be trading shy of its recent highs. However, the declines from last week look increasingly like a successful test of the 50-day moving average, and traders will look to the 7,620 level to see how much resistance it puts up.
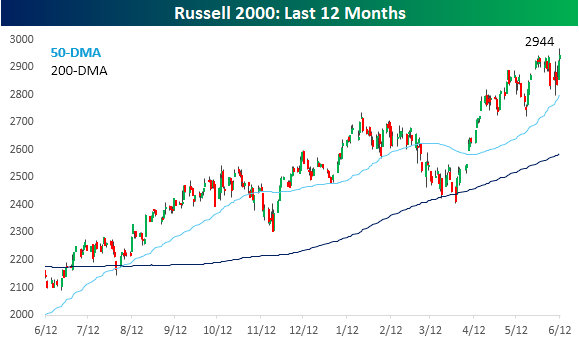
While large-cap stocks are still looking up at prior highs, smaller caps are looking in the opposite direction. The Russell 2000 traded at an all-time high to close out last week and will only add to those levels at the open this morning.
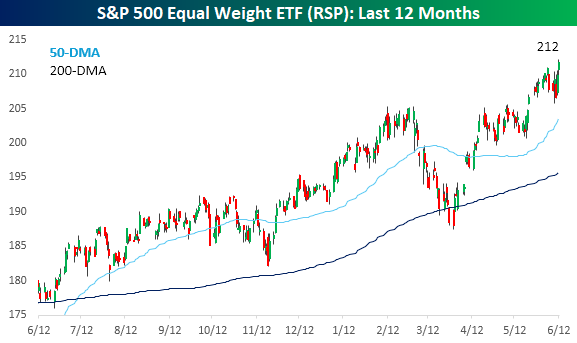
The broadening of the rally also shows up in the performance of the S&P 500 Equal Weight ETF (RSP), which closed at an all-time high last week. While the S&P 500 tested its 50-DMA last week, its Equal Weight peer never even got close to that level.
Start a two-week trial to Bespoke Premium to continue reading today’s full Morning Lineup.
Jun 12, 2026
See what’s driving market performance around the world in today’s Morning Lineup. Bespoke’s Morning Lineup is the best way to start your trading day. Read it now by starting a two-week trial to Bespoke Premium. CLICK HERE to learn more and start your trial.
“I think we have a duty to maintain the light of consciousness, to make sure it continues into the future.” – Elon Musk
Below is a snippet of commentary from today’s Morning Lineup. Start a two-week trial to Bespoke Premium to view the full report.
Start a two-week trial to Bespoke Premium to continue reading today’s full Morning Lineup.
Jun 11, 2026
See what’s driving market performance around the world in today’s Morning Lineup. Bespoke’s Morning Lineup is the best way to start your trading day. Read it now by starting a two-week trial to Bespoke Premium. CLICK HERE to learn more and start your trial.
“Stocks? We don’t have those Enron-type connections.” – Tony Soprano
Below is a snippet of commentary from today’s Morning Lineup. Start a two-week trial to Bespoke Premium to view the full report.
Start a two-week trial to Bespoke Premium to continue reading today’s full Morning Lineup.