Apr 20, 2026
See what’s driving market performance around the world in today’s Morning Lineup. Bespoke’s Morning Lineup is the best way to start your trading day. Read it now by starting a two-week trial to Bespoke Premium. CLICK HERE to learn more and start your trial.
“If you’re in a good situation, don’t worry it’ll change.” – John A. Simone Sr.

Below is a snippet of commentary from today’s Morning Lineup. Start a two-week trial to Bespoke Premium to view the full report.
After a big rally on Friday on homes that the Iran war was ending, futures are lower to start the week as uncertainty over the progress of the war rekindles itself. The damage isn’t nearly as bad as it was earlier, though, as both S&P 500 and Nasdaq futures are down less than 0.5%. Treasury yields are only slightly higher, and while crude is trading up close to 6%, WTI is still below $89 per barrel. Gold prices are down 1%, and Bitcoin is surprisingly higher as it holds above $75K. In the short term at least, the market has taken a two steps forward, one step back mentality.
Despite the weakness in US futures, Asia had a positive session as it played catch-up to Friday’s rally. The Nikkei rallied 0.6% while South Korea added 0.4%. Europe, however, was still open on Friday when the positive news regarding the Strait came out, so this morning, the STOXX 600 is down over 1.1% with Italy and Germany leading the way lower (-1.4%).
The economic calendar is light in the US today, and there isn’t even a lot in the way of earnings reports for investors to digest, but that will change as the week goes on as we head into the peak of earnings season.
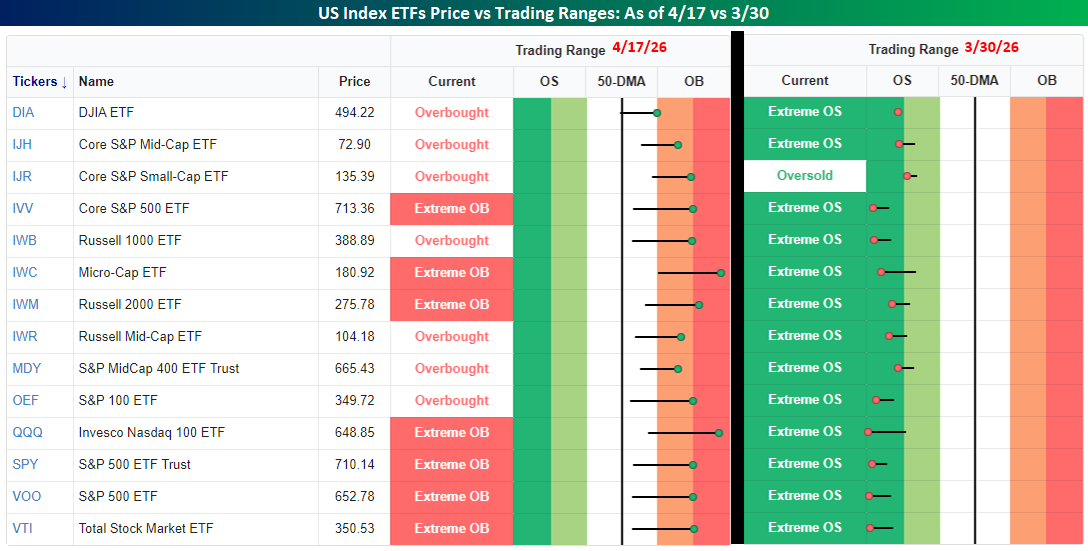
Equities are on pace to start the week lower, but keep in mind how fast it’s recovered. The snapshot below shows where US index ETFs closed out last week relative to their trading ranges compared to where they were as of the close three weeks ago today. As of Friday, every US index ETF in our screen finished off last week at either overbought (1+ standard deviations above the 50-DMA) or extreme overbought (2+ standard deviations above) levels. Three weeks ago, all but one of them were at extreme overbought levels. We’ve come a long way, so some short-term digestion of the moves is only natural.
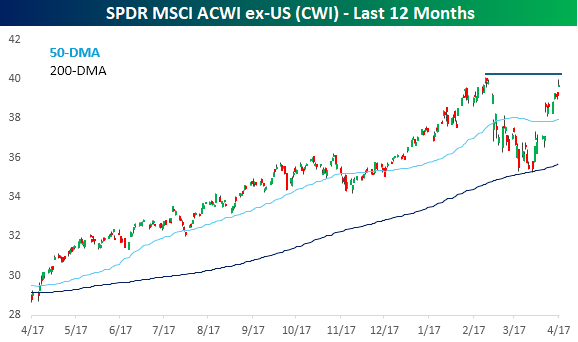
While major US indices closed out the week at record highs last Friday, the same can’t be said for stocks on an international basis. The chart below shows the performance of the SPDR MSCI ACWI Ex US ETF (CWI) over the last year. The sell-off because of the Iran war took the ETF right down to a successful retest of its 200-day moving average, and like the US, the rebound was faster than the decline. Unlike US equities, though, CWI’s rally on Friday stalled out just shy of the all-time highs from late February.
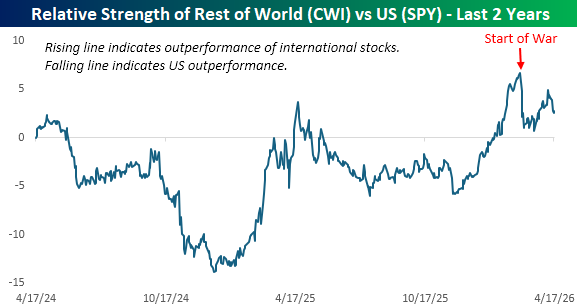
It’s well known by now that the US economy is much more insulated from the issues in the Middle East than the rest of the world, and the chart below illustrates that. On a relative strength basis, international equities bottomed shortly after the 2024 election and reached a short-term peak around Liberation Day last April. Towards the end of last year, as tariff concerns fell off the front page, international stocks started rallying again, hitting a multi-year high right at the end of February.
The start of the war abruptly derailed that outperformance, and while international stocks rebounded in late March into early April, they started to rollover again last week, and look poised ot continue that underperformance today. That weakness was somewhat surprising given it came as tensions in the Persian Gulf started to ease, but if there’s one thing we can all be certain of, the market is always full of surprises.
Start a two-week trial to Bespoke Premium to continue reading today’s full Morning Lineup.
Apr 17, 2026
See what’s driving market performance around the world in today’s Morning Lineup. Bespoke’s Morning Lineup is the best way to start your trading day. Read it now by starting a two-week trial to Bespoke Premium. CLICK HERE to learn more and start your trial.
“Power resides where men believe it resides. It’s a trick. A shadow on the wall.” — Lord Varys, Game of Thrones
Below is a snippet of commentary from today’s Morning Lineup. Start a two-week trial to Bespoke Premium to view the full report.
As if a 12-day rally wasn’t enough for bulls, Nasdaq futures are indicated higher again this morning, putting the index on pace for its 13th day in a row of gains. Both the Nasdaq and S&P 500 are on pace to rally 0.40% while futures on the Dow, which has underperformed recently, indicate a 0.54% gain at the open. The 10-year yield is slightly lower and holding below 4.3% while crude oil flirts with $90 to the downside, falling more than 4%. Gold prices are modestly higher with a gain of 0.34%, while Bitcoin rallies nearly 1% to its highest level since early February.
For much of this year, investors had to put up with weakness heading into the weekend, given all the uncertainty surrounding the war. For the last two weeks, though, investors haven’t been able to resist adding exposure heading into a 48-hour break.
International markets have been more mixed to close out the week, but are still higher for the week. The Nikkei fell 1.8% overnight while Hong Kong, China, and South Korea were all down less than 1%. In Europe, the STOXX 600 is marginally gaining 0.1%, with Italy leading the way (+0.6%) while the UK lags (-0.4%).
Just over two weeks ago, on March 30, the S&P 500 and the Nasdaq closed at their lowest levels since the summer, the Iran war was ongoing, and while Iran’s capabilities were severely damaged, the New York Times warned of a quagmire, saying that “Wounded Iran Is Still Biting: Attacks May Be Fewer But Have Deadly Effect”. Besides all that, it was a Monday too!
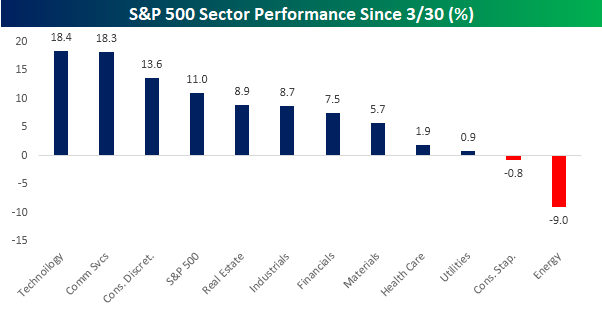
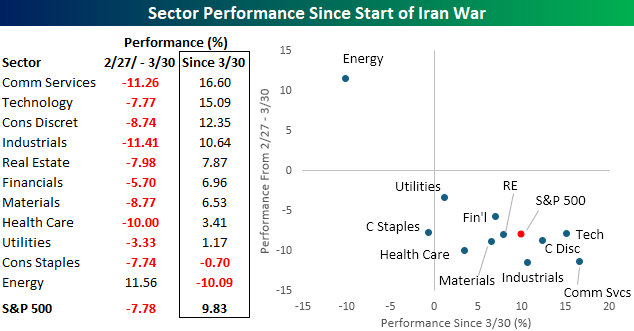
At the time, very few probably anticipated what was in store next for the market. Since that low, the Nasdaq hasn’t closed lower on a single day, and the S&P 500 has rallied in eleven of the last 12 days for a total gain of 11.0%. At the sector level, the rally hasn’t been especially broad, and gains have been concentrated in Technology and Communication Services, which both have surged more than 18%. The only sector that has outperformed the S&P 500 since that low is Consumer Discretionary (+13.6%).
To the downside, Energy has been the main loser with a decline of 9.0%, and the only other sector in the red has been Consumer Staples (-0.8%). As we noted earlier in the week, Consumer Staples is the only sector in the S&P 500 that declined both in the first month of the war from 2/27 to 3/30 and since the 3/30 low.
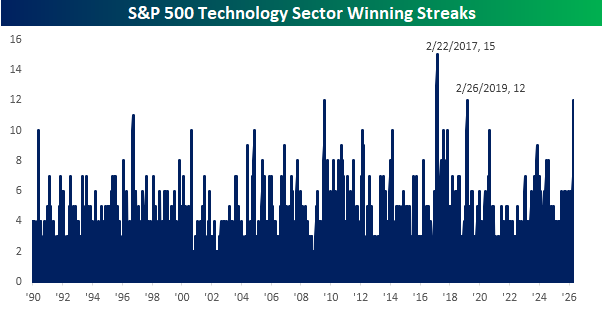
Technology has been the clear leader over the last 12 trading days, and relative to its own history, it’s been an impressive streak. The current streak for the sector is tied with the period ending 2/26/19 for the longest since February 2017. That 15-day winning streak was also the longest in the sector’s history since 1990.
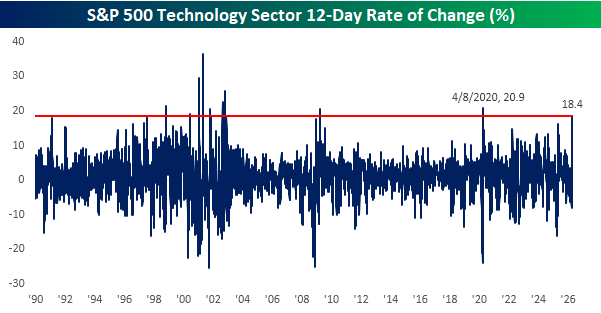
Not only has the sector’s winning streak been among the sector’s best, but the 18.4% rally over the last 12 trading days has been among the strongest since 1990 as well. You have to go back to April 2020, coming out of Covid to find a bigger 12-day rally (+20.9%), and before that, the only larger 12-day gain was in March 2009 coming out of the Financial Crisis. To be sure, not all big 12-day gains for the Technology sector were followed by gains going forward, but the sector’s median gain over the following six and twelve months was 13.8% and 28.1%, respectively.
Start a two-week trial to Bespoke Premium to continue reading today’s full Morning Lineup.
Apr 16, 2026
See what’s driving market performance around the world in today’s Morning Lineup. Bespoke’s Morning Lineup is the best way to start your trading day. Read it now by starting a two-week trial to Bespoke Premium. CLICK HERE to learn more and start your trial.
“Our conviction in the multi-year AI megatrend remains high and we believe the demand for semiconductors will continue to be very fundamental.” – C.C. Wei, President and CEO, Taiwan Semiconductor
Below is a snippet of commentary from today’s Morning Lineup. Start a two-week trial to Bespoke Premium to view the full report.
Before getting to this morning’s note, last night we updated our Bespoke Baskets, where we made two changes to the Growth basket and no changes to the Dividend Income basket. You can view the full update here.
Also, be sure to watch our discussion on markets with Brian Sullivan in a CNBC appearance yesterday.
Futures are indicated higher again this morning as the S&P 500 looks to add to its record highs from yesterday, in what has been one of the most rapid turnarounds in market history. Treasury yields are also lower, while crude oil is just fractionally higher. Both gold and Bitcoin have also shown very modest moves in either direction.
In Asia overnight, most major benchmarks were higher, with the Nikkei up over 2% and China up roughly 1%. In Europe, we’re also seeing gains with the STOXX 600 up 0.4%.
The pace of earnings continues to pick up, but this morning’s focus has been on economic data, and the news was good as both jobless claims and the Philly Fed Manufacturing report exceeded expectations. Lastly, in Fedpseak, NY Fed President John Williams is speaking right now, and he commented that “the No. 1 topic related to the economy is the Middle East conflict, which has introduced substantial risks and heightened uncertainty”.
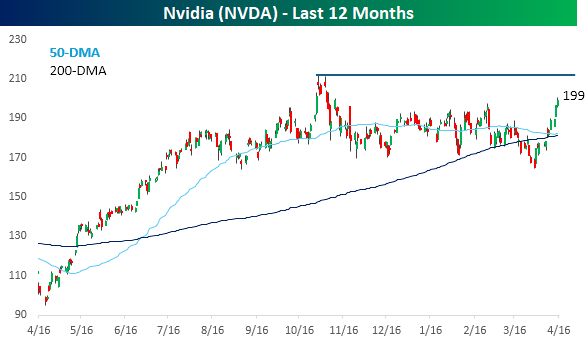
Since it’s not a US company, Taiwan Semiconductor (TSM) doesn’t get a lot of attention in US stock market coverage, which is a mistake. With a market cap of just under $2 trillion, it’s one of the ten largest publicly traded companies in the world. TSM is the linchpin of the global semiconductor supply chain and the global digital economy for that matter. As much as the Iran war has disrupted energy supplies and threatened to derail the global economy, in a scenario where semiconductor supplies from TSM were cut off for an extended period, it would be an economic calamity.
Thankfully, that’s not the case. Overnight, TSM reported better-than-expected EPS and sales and raised guidance. As highlighted in the quote above, the company sees no signs of a slowdown in demand. Revenues rose 40.6% y/y on incredible gross margins of 66.2%.
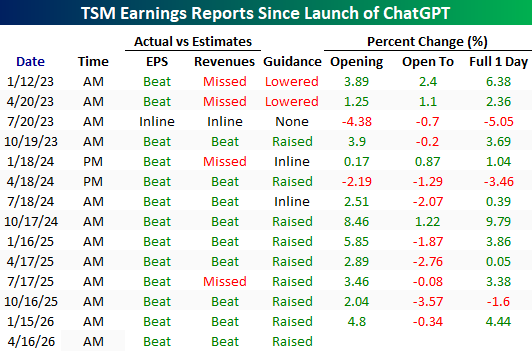
TSM’s results for Q1 were nothing new and continued a trend of strong results since the launch of ChatGPT in late 2022. In the 14 quarters since that launch, the company has reported better-than-expected EPS results 13 times, exceeded sales results nine times, and raised guidance nine times. As shown in the table below, while results relative to expectations were shaky early on in the bull market, more recent results have been consistently strong, with six triple plays in its last seven reports.
Despite the strong results overnight, shares of TSM are trading modestly lower in the pre-market and failed to make a new high in yesterday’s trading, even as the broader market and the Philadelphia Semiconductor Index (SOX) specifically hit new highs yesterday. That’s not to say that the stock hasn’t been a strong performer, though, more than doubling in the last twelve months.
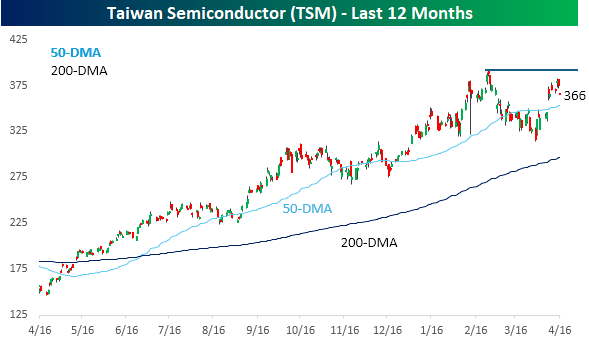
TSM is the second-largest stock in the SOX on a market cap basis, trailing Nvidia (NVDA) by a wide margin. Like TSM, though, NVDA also didn’t join the SOX or the S&P 500 in hitting a new high yesterday. The fact that the SOX has managed to make new highs without the participation of its two largest members illustrates how broad the underlying strength in the sector has been.
Start a two-week trial to Bespoke Premium to continue reading today’s full Morning Lineup.
Apr 15, 2026
See what’s driving market performance around the world in today’s Morning Lineup. Bespoke’s Morning Lineup is the best way to start your trading day. Read it now by starting a two-week trial to Bespoke Premium. CLICK HERE to learn more and start your trial.
“We contend that for a nation to try to tax itself into prosperity is like a man standing in a bucket and trying to lift himself up by the handle.” – Winston Churchill
Below is a snippet of commentary from today’s Morning Lineup. Start a two-week trial to Bespoke Premium to view the full report.
In an unusual picture relative to the post-war periods, US equity futures aren’t showing much in the way of gains or losses. Treasury yields and crude oil are modestly higher, while gold and Bitcoin are slightly lower. Asian stocks were higher overnight, and European stocks are mixed in early trading. Empire Manufacturing and Import Prices both just hit the tape, wth Empire exceeding forecasts while Import Prices came in weaker than expected.
It’s been ten trading days since the S&P 500’s Iran war low, and during that time, the index has rallied just under 10%. Along with that impressive gain, four sectors have rallied more than 10%, including Communication Services and Technology, which are up over 15%. Not bad for two weeks! It’s been almost an everything rally over the last two weeks as the only two sectors to trade lower are Energy and Consumer Staples, although while the latter has only experienced a marginal decline, the former is down over 10%.
Sector moves over the last two weeks have largely been a reversal of the moves since the start of the war. Energy was the only sector to rally from 2/27 through 3/30, and it’s easily the worst performer since then, erasing all its Iran war gain. Conversely, the Technology sector has also more than erased its losses from 2/27 through 3/30. Technology is also a standout. It held up relatively well on the way down (5th best performing sector), but it has still been the second-best performing sector on the way up. Another notable sector has been Consumer Staples. While no sector traded higher in both the periods from 2/27 through 3/30 and since 3/30, Consumer Staples is the only sector to trade lower in both periods.
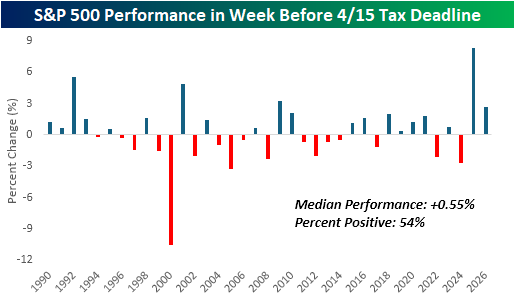
Have you done your taxes yet? With today being the Federal Tax deadline, we wanted to highlight the S&P 500’s performance leading up to and after 4/15. The chart below shows the performance of the S&P 500 in the week before 4/15, dating back to 1990. During that period, the S&P 500’s median performance has been a gain of 0.55% with positive returns 54% of the time. Just looking at the chart, the market has been trendless leading up to the tax deadline.
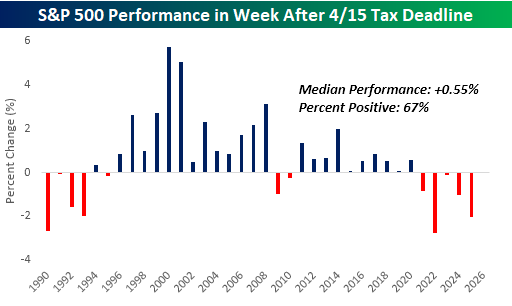
Market performance in the week after Tax Day has shown an evolving pattern over the last several years. While the S&P 500’s median performance in the week after 4/15 has been the same as its performance in the week before Tax Day, there has been a weakening pattern since the turn of the century. The S&P 500’s post-Tax Day performance peaked with a 5.75% gain in the week after Tax Day in 2000, and since then, it has been gradually trending lower to the point where the S&P 500 has declined in the week after for five straight years.
Start a two-week trial to Bespoke Premium to continue reading today’s full Morning Lineup.
Apr 14, 2026
See what’s driving market performance around the world in today’s Morning Lineup. Bespoke’s Morning Lineup is the best way to start your trading day. Read it now by starting a two-week trial to Bespoke Premium. CLICK HERE to learn more and start your trial.
“The clouds appeared and went away, and in a while they did not try anymore.” – John Steinbeck
Below is a snippet of commentary from today’s Morning Lineup. Start a two-week trial to Bespoke Premium to view the full report.
Can we make ten in a row? Along with the Dow and S&P 500, futures on the Nasdaq indicate a gain of over 0.5% at the open, and if those gains hold throughout the session, it would be the Nasdaq’s 10th day in a row of gains. Treasury yields are little changed, but at 4.299%, the 10-year yield is still well off its recent highs. Oil prices are also down over 2% to below $97 per barrel on reports Iran may pause shipping in the Strait of Hormuz to keep potential talks later this week from falling apart. As has been the case recently, signs of easing tensions have also put a bid under gold with the metal up 0.65% to $4,800 per ounce. Lastly, Bitcoin is up another 2% this morning and back above $74K to its highest level since St. Patrick’s Day. If those gains hold, it would also break the downtrend that has been in place since the highs late last year.
After a sluggish start to the week for Asian markets, the region surged overnight with the Nikkei up over 2%, while South Korea’s KOSPI rocketed 2.7% higher. Chinese stocks rallied more than 1% despite a stronger-than-expected trade surplus as imports surged 27.8% y/y compared to expectations for an increase of 11.1% while exports rose less than expected (2.5% vs 8.3%).
European stocks are also higher, although not by as much as in Asia. The STOXX 600 is up 0.6% with Germany leading the way higher (+1.0%) while the UK lags (+0.1%). One area of weakness in the region is the luxury goods sector, where weak results from LVMH drag that group lower.
The Nasdaq has now rallied over 12% since its intraday low on 3/30, and the rally ironically comes just as the index’s 50-day moving average (DMA) looks to cross down through its 200-DMA. That’s traditionally considered a bearish development, although history shows that theory is misplaced.
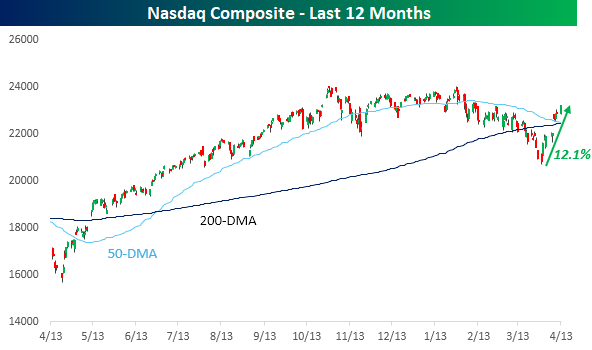
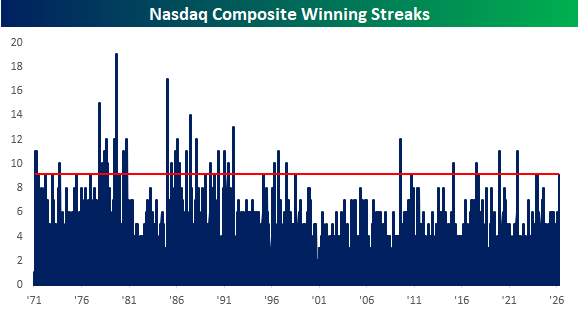
Since the rally off the March 30 lows, the Nasdaq hasn’t had a down day, rallying for nine straight days. That’s tied for the longest winning streak in the index since November 2021, and if today’s pre-market gains hold, it would be the index’s 34th double-digit winning streak. As shown in the chart below, these types of streaks were relatively common in the 1970s and 1980s, but their frequency has waned since 2000.
One driver of the Nasdaq’s gains has been semiconductors, which have been cooking. Since its low on 3/30, the Philadelphia Semiconductor Index (SOX) rallied an impressive 27.6%. Making this even more impressive is that the index’s largest component – Nvidia (NVDA) – has rallied just 15% off its intraday low on 3/30. One stock in the sector stealing the show has been Intel (INTC), which, as we noted yesterday, has had its largest nine-day rally in at least 40 years. Whatever stock has been driving the SOX, the index has more than erased its declines from the Iran war and now trades at record highs.
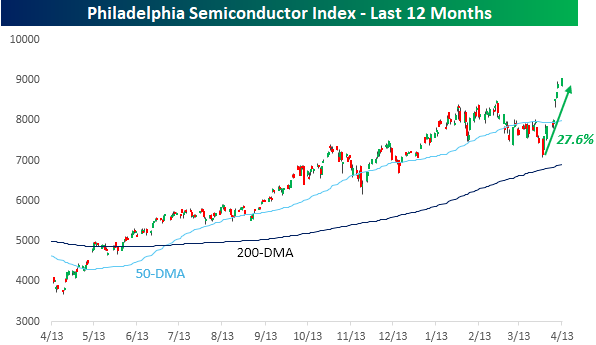
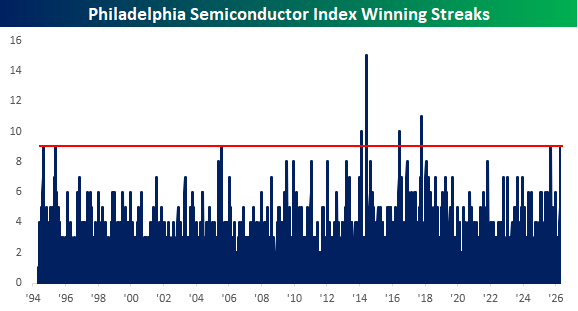
Like the Nasdaq, yesterday’s rally took the SOX’s winning streak to nine days. That’s already tied for the longest winning streak since 2017, and if today’s pre-market gains hold, it would be just the fifth double-digit winning streak in the index’s history.
Start a two-week trial to Bespoke Premium to continue reading today’s full Morning Lineup.
Apr 13, 2026
See what’s driving market performance around the world in today’s Morning Lineup. Bespoke’s Morning Lineup is the best way to start your trading day. Read it now by starting a two-week trial to Bespoke Premium. CLICK HERE to learn more and start your trial.
“Nothing gives one person so much advantage over another as to remain always cool and unruffled under all circumstances.” – Thomas Jefferson
Below is a snippet of commentary from today’s Morning Lineup. Start a two-week trial to Bespoke Premium to view the full report.
The week hasn’t even started yet, but it’s been volatile already as equity futures gapped down more than 1% at the open last night and then rallied right up until around 7 AM when Goldman (GS) reported. That stock is down over 4% in pre-market trading, and the S&P 500 is now set to gap down 0.63%.
The culprit behind this morning’s weakness is once again the Middle East, as President Trump’s plan to put a blockade on the Strait of Hormuz has crude oil up over 7% and back above $100 per barrel. With crude oil up as much as it is, you could argue that equities should be down more based on the relationship between the two since the war started, but as earnings season kicks off, the market is starting to trade on more than just oil prices.
In Asia and Europe overnight and this morning, the overall trend is lower as major averages on both continents declined or are trading down about 1%. Gold prices are also trading down about 1%, while Bitcoin is only fractionally lower, just below $71K.
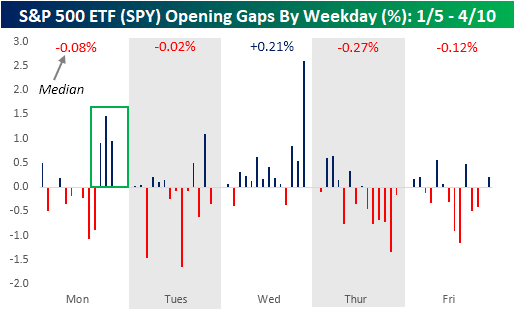
As mentioned above, futures are off the initial lows from last night, but with the S&P 500 ETF (SPY) on pace to gap down 0.62% at the open, it would be the third-largest downside opening gap on a Monday of the year. It would also break a streak of four straight weeks where the market gapped higher on a Monday. Even during a war, Mondays haven’t been that bad lately. For the entire year, though, SPY’s median gap on Mondays has been a decline of 0.08% with positive returns half of the time.
The weakest day of the week in terms of where the market opens has clearly been Thursday. For the entire year, the average downside gap on Thursdays has been a decline of 0.27%, and since the war started, SPY has gapped down on every Thursday. As bad as Thursdays have been at the open, Wednesdays have been solid. On the 14 Wednesdays so far in 2026, SPY has gapped higher 12 times for a median gain of 0.21%.
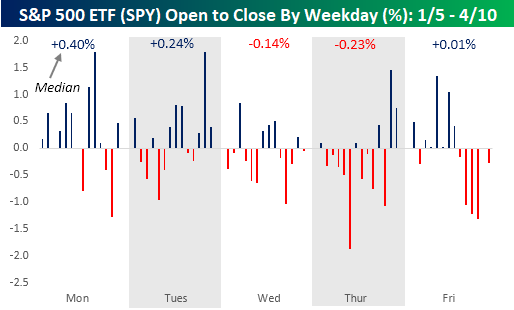
Where the market opens is one thing, but where it goes for the next 6.5 hours from the open to close is just as important. While Mondays have been modestly negative at the open, it has been the best day of the week from the open to close with a median gain of 0.40% and positive returns 75% of the time. With a median open-to-close gain of 0.24%, Tuesdays haven’t been as bad either. From there, though. The trading day only goes downhill from there, though. SPY’s median change from the open to close on Wednesday has been a decline of 0.14%, with positive returns barely more than a third of the time. Thursdays are even worse with a median decline of 0.23%. While Friday’s median open-to-close change has been slightly positive, since the war started, SPY has declined from the open to close on Fridays every time for a median decline of just over 1% (-1.04%).
Start a two-week trial to Bespoke Premium to continue reading today’s full Morning Lineup.