Jan 12, 2026
See what’s driving market performance around the world in today’s Morning Lineup. Bespoke’s Morning Lineup is the best way to start your trading day. Read it now by starting a two-week trial to Bespoke Premium. CLICK HERE to learn more and start your trial.
“Maintain a firm grasp of the obvious at all times.” – Jeff Bezos

Below is a snippet of commentary from today’s Morning Lineup. Start a two-week trial to Bespoke Premium to view the full report.
As of early Sunday afternoon, it looked as though the news surrounding the anti-regime protests in Iran or the President’s call for a one-year cap on credit card interest rates at 10% would be the major news catalysts for trading to kick off the week. Then, last night, news broke that the Department of Justice had opened a criminal investigation into Federal Reserve Chair Jerome Powell related to the $2.5 billion renovation of the Federal Reserve’s headquarters. Powell responded that the investigation was “a consequence of the Federal Reserve setting interest rates based on our best assessment of what will serve the public, rather than following the preferences of the President.” He went on to add that this investigation will determine “whether the Fed will be able to continue to set interest rates based on evidence and economic conditions — or whether instead monetary policy will be directed by political pressure or intimidation.”
The President (as you would expect) denied any involvement in the investigation, and while it obviously looks political, the reality is that, provided he did nothing wrong, which we have no reason to believe he did, Powell should have nothing to worry about. The bigger question, in our mind, is who in their right mind would ever want Powell’s job? If I’m one of the Kevins, or any of the other people that prediction markets have as succeeding Powell, I’d be cheering every time my odds went down!
S&P 500 futures are down 0.5% leading up to the opening bell, while the Nasdaq is down 0.75%. Treasury yields are slightly higher, with the 10-year yield up 2 bps to 4.19%, while the dollar is lower. Crude oil is fractionally lower while gold is surging more than 2.5%. All these moves suggest a possible return of the ‘sell America’ trade; at this point, the moves are much too modest to suggest that it is a real concern.
Despite the weakness in US futures, Asian stocks kicked off the week on a positive note. While Japan was closed for a holiday, both onshore and offshore Chinese stocks were up over 1% while South Korea rallied 0.8%. India and Australia were also higher by about 0.5%. South Korea export data showed that while overall exports in the first ten days of January were down 2.3% y/y, chip exports increased over 45%!
In Europe, equities have started the week in a more muted fashion than Asia. The STOXX 600 is slightly lower, while German stocks buck the trend with a gain of 0.5%. There hasn’t been a lot of news specific to the continent this morning, but Sentix Investor Confidence for January did come in less weak than expected.
Before the Powell headlines broke yesterday, news earlier in the weekend about the President calling for a one-year cap of 10% on credit card interest rates looked like it would be the biggest news story heading into the new week. While the President can’t directly force the credit card issuers to cap interest rates, he can make life difficult for them through the bully pulpit of his Truth Social account and the various regulatory agencies that the issuers fall under the purview of.
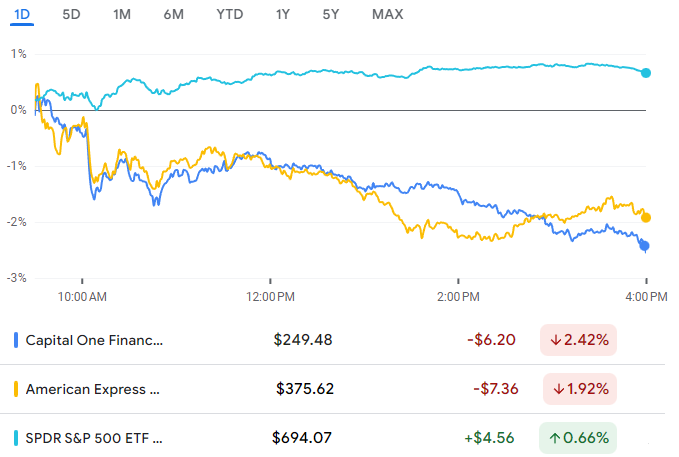
In response to the President’s comments over the weekend, American Express (AXP) and Capital One (COF), two of the biggest pure-play credit card issuers, are trading sharply lower. AXP is down over 4% while COF is down twice that, with a loss of over 8%. The Financial sector and banks, in general, are also weak today, but nowhere nearly as much as AXP or COF. The weakness in both stocks comes after they finished last week right near 52-week highs. Looking at the price charts of both stocks, though, you can see that they closed near their lows of the day last Friday (top two charts) while the S&P 500 finished the week right near its highs of the day.
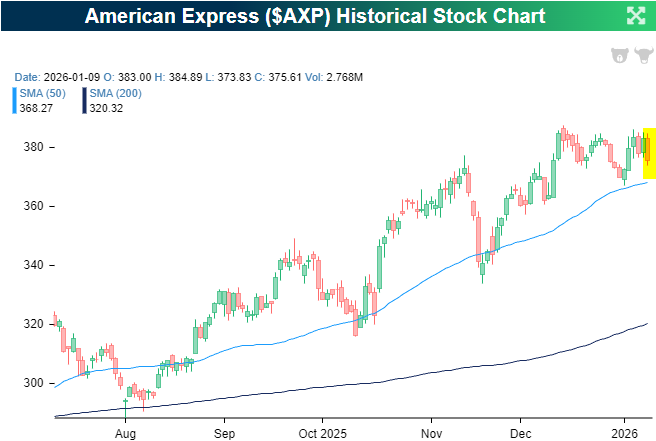
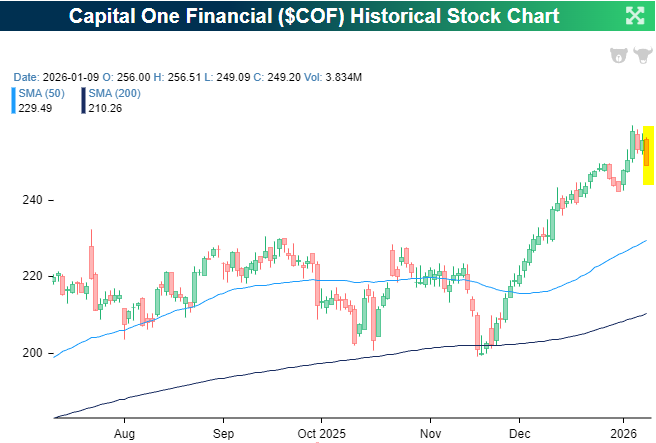
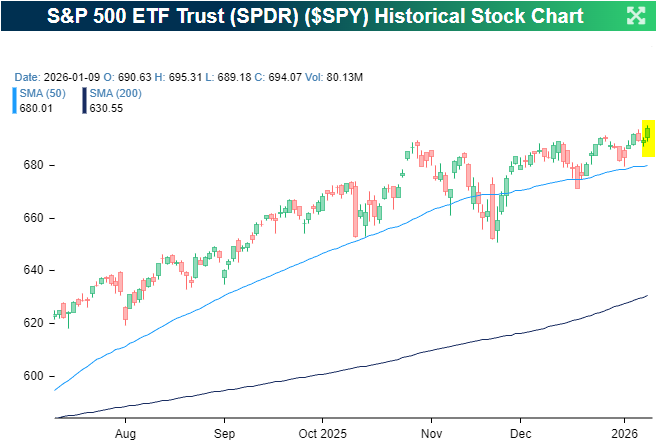
The intraday performance of all three shows the divergence even more clearly. As the S&P 500 rallied intraday, both AXP and COF drifted lower all day. It’s hard to look at this chart and not think that someone knew something.
Jan 9, 2026
See what’s driving market performance around the world in today’s Morning Lineup. Bespoke’s Morning Lineup is the best way to start your trading day. Read it now by starting a two-week trial to Bespoke Premium. CLICK HERE to learn more and start your trial.
“When the President does it, that means that it is not illegal.” – Richard Nixon
Below is a snippet of commentary from today’s Morning Lineup. Start a two-week trial to Bespoke Premium to view the full report.
Asian stocks finished the week on a positive note, and, in most cases, extended their gains for the week. Japan was up 1.6% to finish the week up 3.2%, while China was up even more as its 0.9% rally took the weekly gain to 3.8%. The real action, though, was in South Korea, where the KOSPI rallied 0.8% to finish the week up 6.4%. It’s now up an incredible 8.8% YTD and has traded higher on all six trading days this year. For some perspective on the KOSPI’s gain, it’s now up more YTD than its median annual performance!
Like Asia, European stocks are higher to close out the week, finishing an already positive week on a good note. The STOXX 600 is up 0.6% and nearly 2% on the week, while Germany is on pace to finish the week up 2.8%. Spain is the only major European country lower on the day (-0.4%), and it’s also the biggest laggard for the week. That underperformance, though, comes after it was the best-performing major country in the region last year. This morning’s strength in Germany comes after industrial production in the country unexpectedly grew 0.8% versus expectations for a decline of 0.6%.
In the US, equity futures are on hold with very modest gains ahead of a busy slate of economic data coming at 8:30 with non-farm payrolls, building permits, and housing starts. Then, at 10 AM, we’ll get an update on sentiment from UMich. We’ll also be on the lookout later today for a possible SCOTUS decision related to the Trump tariffs. The consensus view is that they will be struck down in some form, but echoing the sentiment of Richard Nixon, President Trump hopes that since he did it, the court will find the tariffs to be legal.
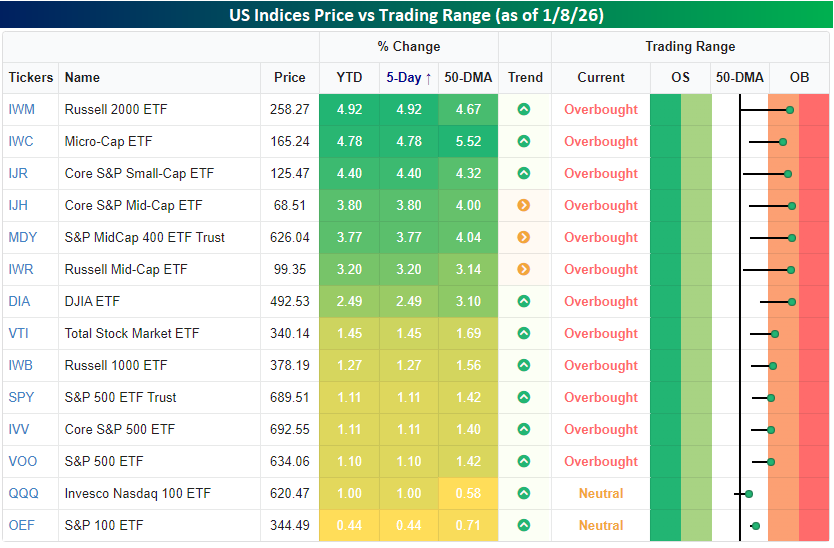
Today is a fun day when it comes to our Trend Analyzer tool, as the YTD performance numbers match the 5-day performance numbers. Interestingly enough, though, since most US indices closed out last year right near their 50-DMAs, the spreads are also very similar to the performance numbers! As things stand after the first full-week of trading, every major index ETF is up YTD, and all but two are overbought. The only outliers are the S&P 500 (OEF) and the Nasdaq 100 (QQQ). At least in the early going, 2026 isn’t the year of the Megacaps. Small caps have been the leaders early on in the year as the Russell 2000 is already up close to 5%.
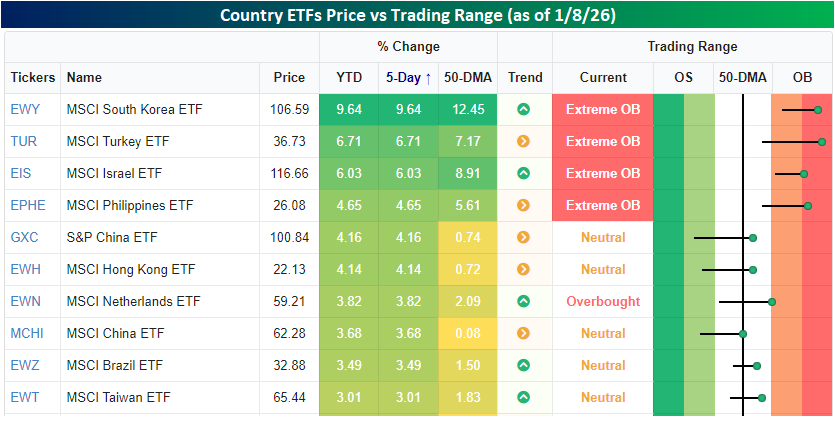
Outside of the US, the ten best country ETFs are listed in the table below. As mentioned above, South Korea has been a standout performer this year, and the MSCI South Korea ETF (EWY) is already up close to 10% YTD. Not surprisingly, the strong gains to start the year have put the ETF into extreme overbought territory, along with Turkey (TUR), Israel (EIS), and the Philippines (EPHE).
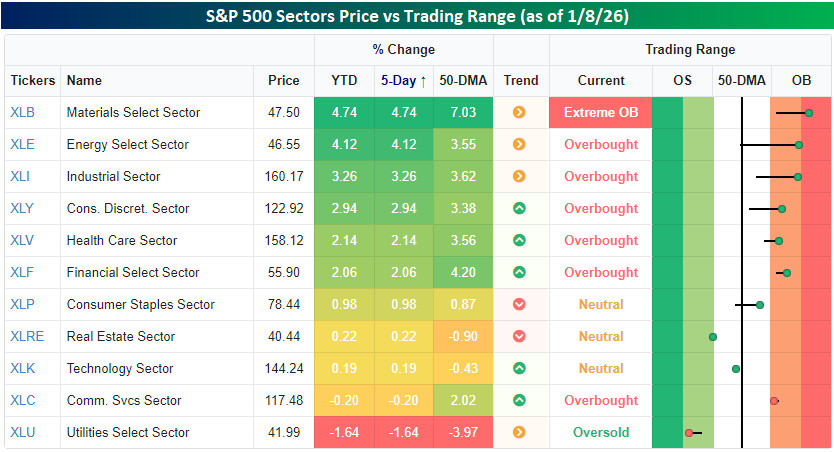
Shifting focus back to the US, this year’s rally so far has been led by commodities as Materials (XLB) and Energy (XLE) have both already rallied over 4%, followed by Industrials (XLI) and Consumer Discretionary (XLY) with gains of over 2.5%. On the downside, Utilities (XLU) have been a major laggard. After a 1.6% YTD decline, it’s the only oversold sector in the S&P 500, and one of just three sectors – Technology (XLK) and Real Estate (XLRE_ being the other two- below its 50-DMA.
Jan 8, 2026
See what’s driving market performance around the world in today’s Morning Lineup. Bespoke’s Morning Lineup is the best way to start your trading day. Read it now by starting a two-week trial to Bespoke Premium. CLICK HERE to learn more and start your trial.
“Tomorrow belongs to those who can hear it coming” – David Bowie
Below is a snippet of commentary from today’s Morning Lineup. Start a two-week trial to Bespoke Premium to view the full report.
It looks like a negative start to the Thursday session for equities, as the S&P 500 and Nasdaq both decline between 0.2% and 0.3%, while Treasury yields tick higher with the 10-year yield up to 4.16%. Oil prices bounced 1.5%, but WTI still trades below $57 per barrel. In the metals space, there’s broad-based weakness with gold down about 1%, copper down fractionally, while silver and platinum both fall 4%. After a rally to start the year that took its price over $90K, Bitcoin is back down below $90K. The only data on the economic calendar today are jobless claims at 8:30, along with Nonfarm Productivity and Unit Labor Costs at the same time.
The weakness in US futures follows a weak session in Asia, where Japan, Hong Kong, and India were all down 1%. Despite the declines, South Korea managed to outperform again, finishing unchanged on the session as Samsung Electronics reported better than expected results.
In Europe, stocks are also lower with the STOXX 600 trading down 0.4%, with Spain the only positive outlier. December Business and Consumer Confidence pulled back modestly more than expected as the headline index fell from 97.1 down to 96.7, versus forecasts for a level of 97.0.
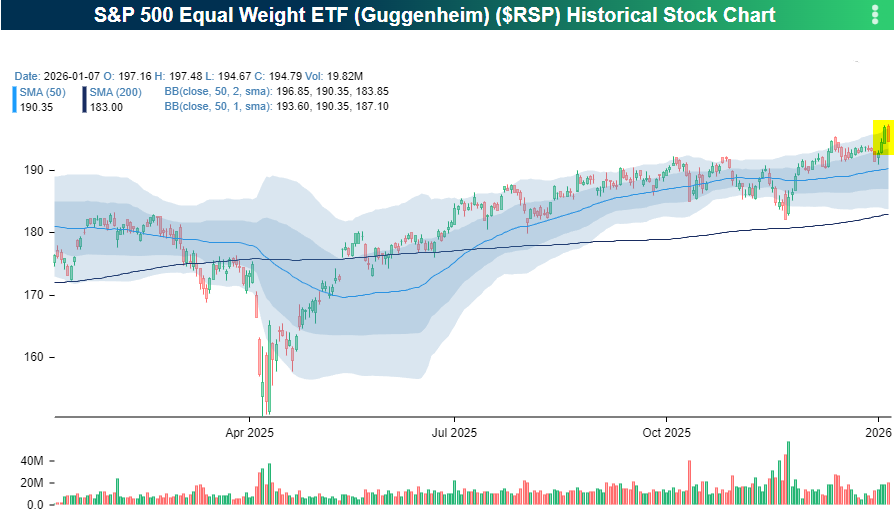
We’re four trading days into the year, and already there have been some big individual stock winners. Within the S&P 500, 22 stocks are already up over 10% YTD, while none are down 10%, and only 25 are down by 5% or more. In total, breadth in the market has been positive as 316 of the index’s 500 components are up YTD. The positive breadth is also illustrated by the fact that the equal-weight S&P 500 index is up 1.7% YTD compared to a gain of 1.1% for the cap-weighted index.
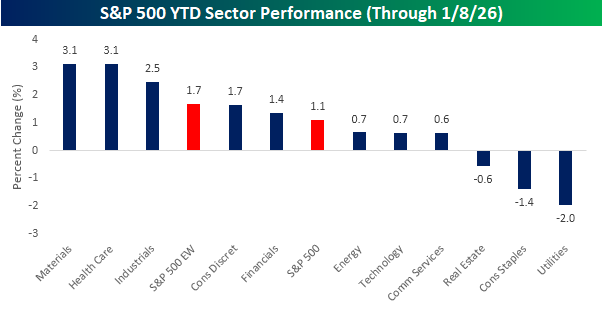
At the sector level, five are outperforming the index YTD, while six lag. Leading the way to the upside, Materials and Health Care are both up 3.1%, followed by Industrials with a gain of 2.5%. Technology’s 0.7% gain modestly trails the index, and three sectors – Utilities, Consumer Staples, and Real Estate are all down after four days of trading.
Before yesterday, breadth in the market was even stronger, but while the S&P 500 had a modest decline of 0.34%, the equal-weight index fell more than 1%. That decline also erased nearly all of what was looking like a breakout in the equal-weight index after a multi-month period of sideways trading. Every time it seems like the rally will broaden, Lucy goes in and swipes the football away.
Jan 7, 2026
See what’s driving market performance around the world in today’s Morning Lineup. Bespoke’s Morning Lineup is the best way to start your trading day. Read it now by starting a two-week trial to Bespoke Premium. CLICK HERE to learn more and start your trial.
“Without memory, there is no culture. Without memory, there would be no civilization, no society, no future.” – Elie Wiesel
Below is a snippet of commentary from today’s Morning Lineup. Start a two-week trial to Bespoke Premium to view the full report.
It’s another flat morning for US equity futures, as S&P 500 futures are flat while the Nasdaq is indicated to open down 0.20%. Treasury yields are down over 5 bps, taking the 10-year yield down to 4.12% as the monthly ADP Employment report came in roughly in line with expectations. Crude oil is lower and trading down to $57 per barrel as the US just announced that Venezuelan sanctions will be rolled back to enable the sale of additional oil. In the precious metals space, gold is down 1%, while silver, copper, and platinum look at much steeper losses as volatility in that space continues.
Asian stocks took a more mixed path overnight, with the Nikkei and Hang Seng both falling close to 1%, while the Shanghai Composite had a marginal gain. South Korea led the way to the upside once again, rallying 0.6%. The index has now closed at record highs every day this year as memory stocks like Samsung Electronics and SK Hynix have surged 17.6% and 14.0% YTD, respectively. It also comes just a day ahead of earnings from Samsung Electronics tomorrow.
European stocks are mixed. While the STOXX 600 is up 0.1%, the only major country benchmark trading higher is Germany (+0.6%). CPI for the Eurozone came in at 2.0% y/y, which was right in line with forecasts and down modestly from November’s reading of 2.1%.
For years, memory was an afterthought in the technology investment space and considered nothing more than a commodity. Based on the last year, though, Elie Wiesel may have been right all along in terms of its importance as stocks tied to the sector have gone berserk. Yesterday, we noted that despite the last numbers on the calendar changing a week ago, not much else has changed in terms of stock price performance this year. The two top-performing stocks in the S&P 500 last year were Western Digital (WDC) and Micron (MU), which both rallied over 200%. Three days into the new year, both stocks are up over 20%! Sandisk (SNDK), which didn’t even trade for a full year in 2025, was up 560% from its IPO in February through year end. This year, it’s already up 47% – in three trading days, one of which was a down day!
Of the main memory stocks, WDC has the longest history, so we wanted to highlight some charts showing how extreme the moves have been.
First, simply looking at a one-year chart, the stock was under $65 per share a year ago, but after falling more than 40% from its February high through its April low, the stock hasn’t looked back. Even the biggest winners have their fair share of volatility.
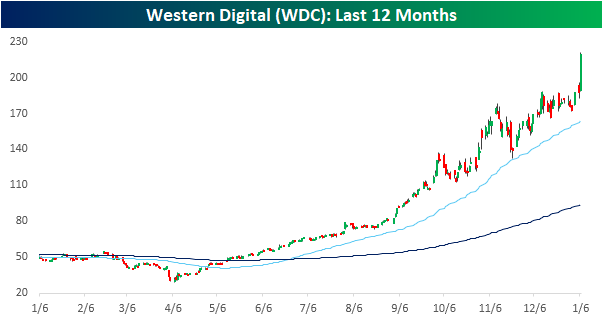
From a longer-term perspective, the price chart looks like a hockey stick, or the inverse of the US turkey population on a YTD basis through Thanksgiving. From 1986 through earlier last year, the stock never traded about $100 per share (on a split-adjusted basis), but yesterday it closed above $200.
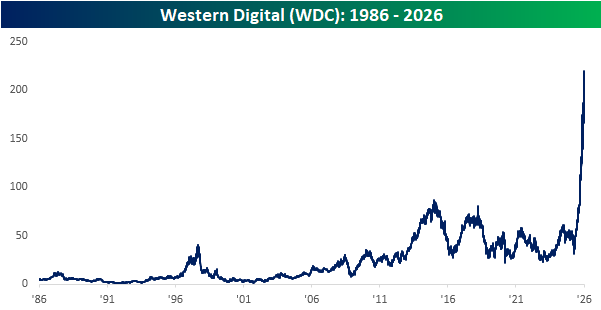
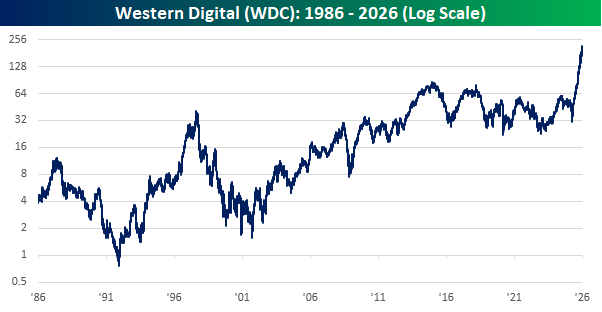
Looking at the stock’s price history using a log scale where each gridline represents a doubling of the stock price, the chart looks more reasonable, but the slope of the move in the last year is still unprecedented.
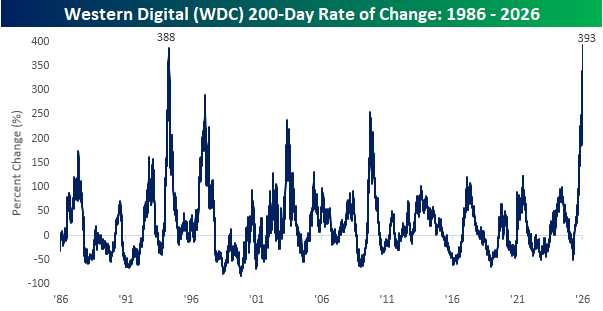
The next chart is perhaps the most incredible regarding WDC’s recent rally. Through yesterday’s close, WDC’s share price rallied 393%, which was up from a 200-day move of 318% the day before. With that move, the stock’s rally over the last 200-days is larger than any other 200-day rally since at least 1986. That’s over 40 years!
Jan 6, 2026
See what’s driving market performance around the world in today’s Morning Lineup. Bespoke’s Morning Lineup is the best way to start your trading day. Read it now by starting a two-week trial to Bespoke Premium. CLICK HERE to learn more and start your trial.
“The freshest moments in my films have always been with unknown actors.” – John Singleton
Below is a snippet of commentary from today’s Morning Lineup. Start a two-week trial to Bespoke Premium to view the full report.
The rally in the US to kick off the week yesterday continued overnight in Asia as Japan, China, and South Korea all rallied between 1.0% and 1.5%. The strength came amid a weaker manufacturing PMI reading in Hong Kong and a weaker services PMI in India. In China, the PBoC said that monetary policy would be maintained at loose levels to further support growth.
European stocks are also positive, but with more modest gains. The STOXX 600 is up 0.2%, and France’s 0.1% decline is the only major country benchmark in the red as bank stocks lag. The December Services PMI for December came in slightly weaker than expected, decelerating to 52.4 from 53.6 in November.
In the US, futures are on either side of the flatline, with S&P 500 futures barely higher, while Dow futures are barely lower. Nasdaq futures are faring better, but with an implied gain of 0.22% aren’t shooting the lights out. Treasury yields, crude oil, and gold are all fractionally higher, while silver, platinum, and palladium are all up over 1%. After a solid rally yesterday, which took it to its best levels in six weeks, Bitcoin is down modestly at just under $94K.
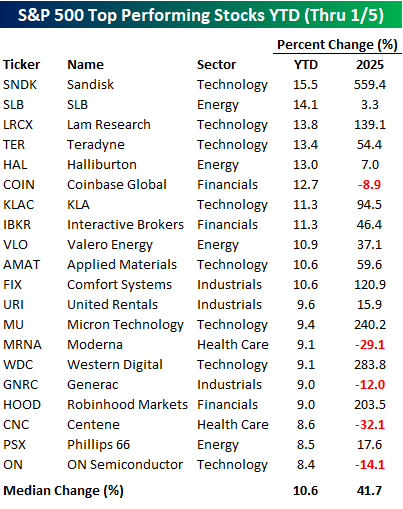
The market is always changing, but just because the year on the calendar changed last week, the performance of stocks leading the way higher hasn’t changed all that much- at least not yet. The table below lists the 20 best-performing S&P 500 stocks so far this year. For starters, Sandisk (SNDK) is the best-performing stock this year, and it was also the best in the S&P 500 last year, even though it didn’t have a full year of trading to gain more than 500%!
Besides SNDK, five of the other top performers were also stocks that more than doubled in 2025! Sure, there were some losers last year, like Centene (CNC) and Moderna (MRNA), that have gotten off to a strong start this year, but overall, last year’s median performance of the 20 best-performing S&P 500 stocks so far this year was a gain of 41.7%. The list is also dominated by tech, with eight of the 20 stocks coming from that sector.
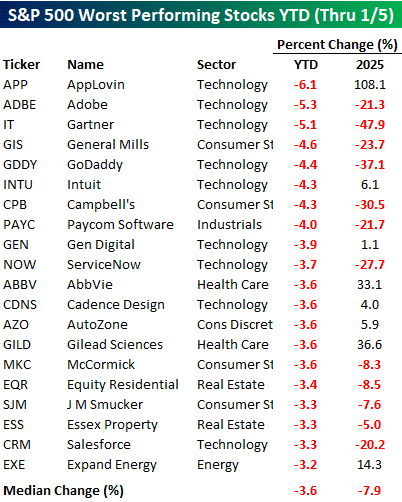
While eight of the 20 best-performing stocks in the S&P 500 so far this year are from the Technology sector, nine of the worst performers are also from the S&P 500’s largest sector. Besides AppLovin (APP), though, none of them were big winners in 2025. Of the 20 worst performers in the first two trading days of 2026, twelve were also down in 2025, and the median decline of all 20 was 7.9%. It’s also worth pointing out that the magnitude of the declines in the biggest losers so far this year is basically a third of the magnitude of the size of the gain in the biggest winners (-3.6% vs 10.6%).
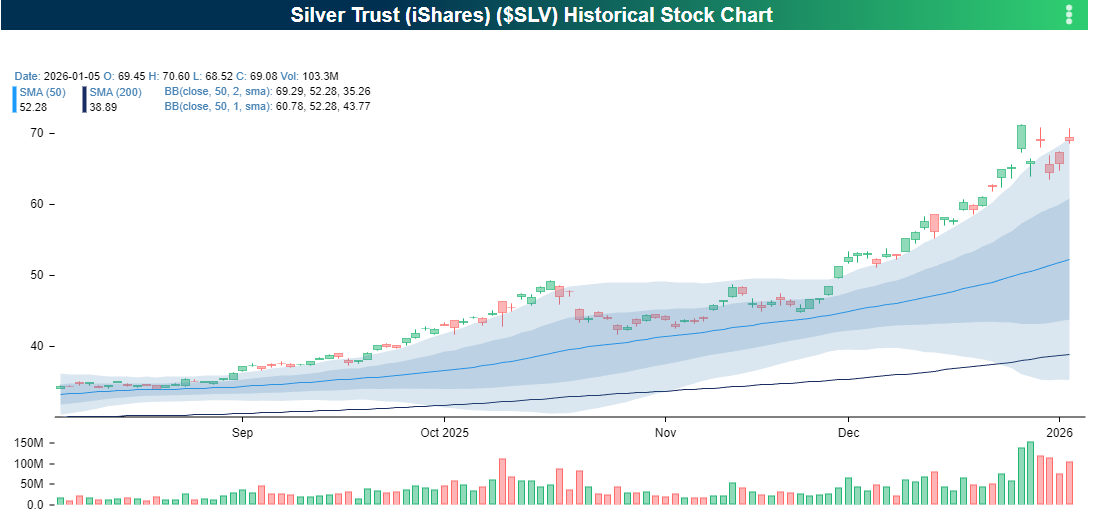
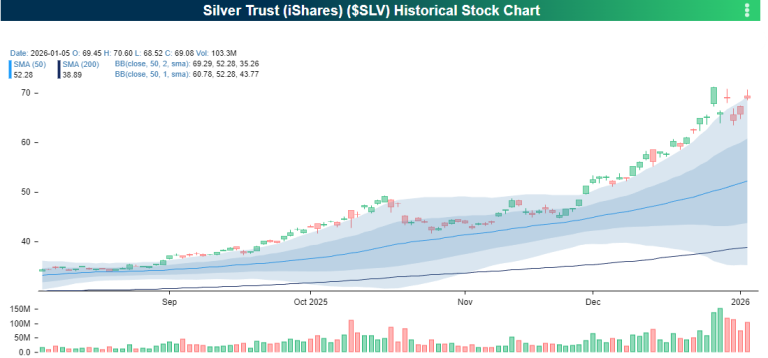
Another area where the change in the calendar didn’t impact that market was in the volatility of various metals. Silver is a perfect example, as volatility in gold’s bridesmaid hasn’t skipped a beat in the first two trading days of 2026. While silver only moved 0.58% last Friday, yesterday’s 7.1% rally was right in line with what has become the norm in recent weeks, and the chart is beginning to look increasingly funky with multiple detached candles with no overlap to the prior day’s range.
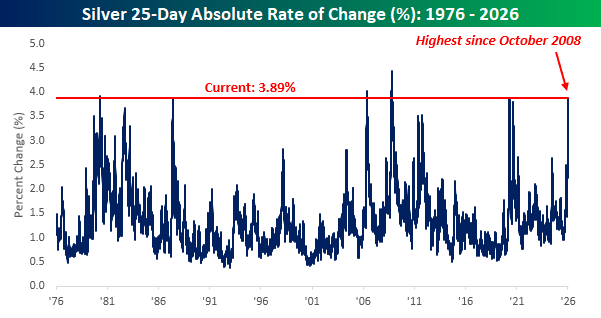
Over the last six trading days, silver’s daily move has been above 7% on five separate trading days, and the average daily move during the last 25 trading days has been 3.89%. That’s the highest average daily move over five weeks since October 2008, and there have only been a handful of periods in the last 50 years where the average daily move was higher. It doesn’t get more volatile than that. Somebody better put a ring on it.
Jan 5, 2026
See what’s driving market performance around the world in today’s Morning Lineup. Bespoke’s Morning Lineup is the best way to start your trading day. Read it now by starting a two-week trial to Bespoke Premium. CLICK HERE to learn more and start your trial.
“What can a first impression tell us about anyone? Why, no more than a chord can tell us about Beethoven, or a brushstroke about Botticelli.” – Amor Towles
Below is a snippet of commentary from today’s Morning Lineup. Start a two-week trial to Bespoke Premium to view the full report.
Asian markets were the first to react to the Venezuela news from Saturday, and the response was positive. Japan’s Nikkei rallied 3% while China’s Shanghai Composite tacked on 1.4%, and South Korea surged 3.4%. India was a notable laggard in a sea of green as IT firms in the country declined after some cautious comments regarding the sector from Citi.
In Europe, the tone to start the week has been more subdued. The STOXX 600 is up 0.3% on modestly negative breadth. Germany is leading the way higher with a gain of 0.6% while Spain is fractionally lower.
In the US, S&P 500 futures are up nearly 0.30% while the Nasdaq is doing much better with a gai of over 0.6%. Treasury yields are little changed, and surprisingly, crude oil is only up fractionally. Gold is surging more than 2% while other metals prices are all up by at least twice that. Even crypto is catching a bid as Bitcoin is up over 1.5% and near $93K. If you’re a bull, it’s nice to see a positive reaction to the weekend news on the first real full trading day of the year, but we’ll be watching to see if the gains can be held through the trading session, which is a job the market has had a tougher time of doing in recent weeks.
With the start of every new year, investors tend to pay a lot of attention to first impressions. A strong start to the year raises hopes of a strong year, while weakness out of the gate causes investors to ask whether the market knows something for the year ahead. With the S&P 500 trading higher on Friday, the logic says that it should bode well for the rest of the year. Right?
Whether stocks trade up or down to start the year is basically meaningless in the grand scheme of things. Going back to 1953, which was the first full year of the five-day trading week in its current form started, we looked to see how the S&P 500 performed on the first trading day of the year and then compared it to how it performed over the next week, the rest of January, the rest of the quarter, the rest of the half, and the rest of the year.
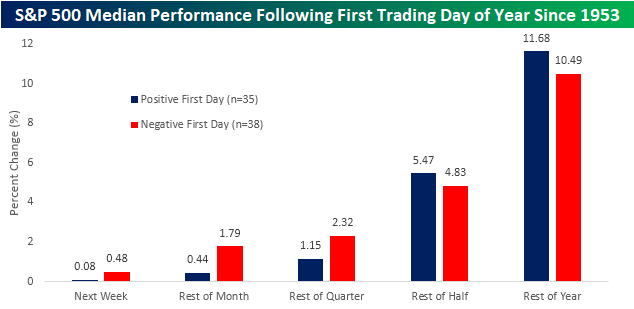
The chart below shows the S&P 500’s median performance following days when it was positive on the first trading day of the year (blue bars) and negative (red bars). Over the following week as well as the rest of the month and quarter, the S&P 500’s median performance was actually better following a down day to start the year than after a positive start. For the rest of the half and the rest of the year, though, performance was better following a positive start to the year. In both cases, though, the difference in returns was modest.
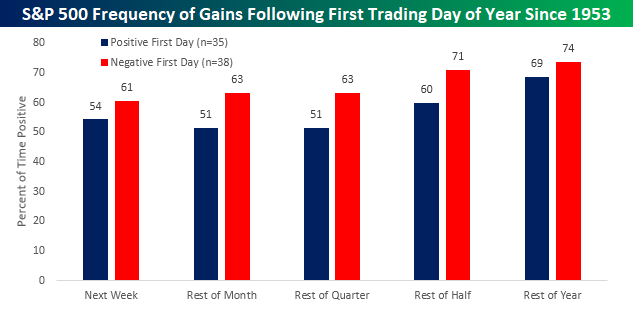
In terms of the consistency of gains based on first-day performance, the S&P 500 has been positive on a slightly more consistent basis following a negative start to the year, versus a positive start. Once again, though, the differences are modest at best.
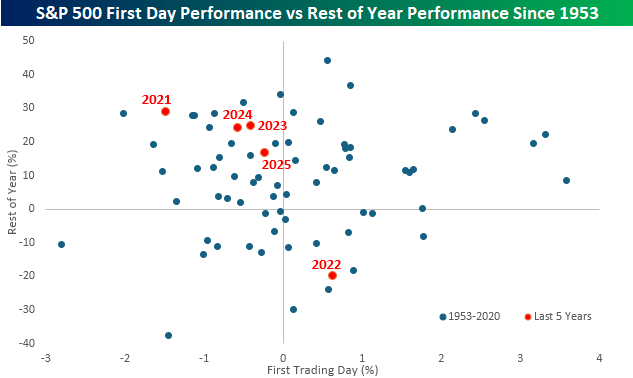
Not only have first impressions had little bearing on how the market performed going forward, but in recent years, it’s been the opposite. The scatter chart below compares the performance of the S&P 500 on the first trading day of the year (x-axis) to its performance for the rest of the year (y-axis). The random scattering of the dots provides another illustration of the lack of correlation.
One exception, however, has been the last five years (red dots). From 2021 through 2025, the S&P 500 traded down on the first trading day of the year four out of five times. 2022 was the only year that the first trading day was positive, when the S&P 500 traded up 0.64% to kick off the year. From the close on that first day through year-end, the S&P 500 dropped 19.95%. In the four other years when the S&P 500 traded down on the first trading day of the year, the S&P 500 rallied anywhere between 16.7% and 28.8% for the rest of the year. You would never base a prediction for the outcome of a baseball game on whether the first pitch was a ball or a strike, so don’t base your outlook for the year on which way the market trades on a day when most people were out of the office anyway. Even if it was higher.