May 27, 2026
Log-in here if you’re a member with access to the Closer.
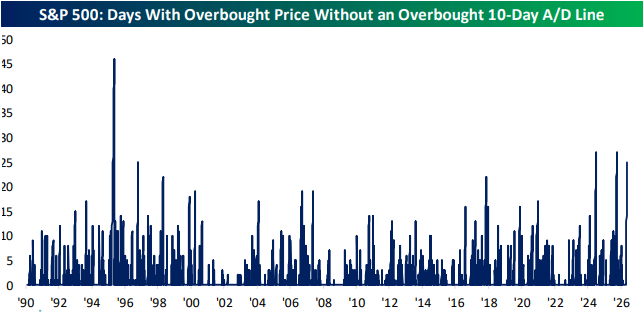
- The S&P 500 has been overbought for 31 days in a row, but the 10-day A/D line hasn’t experienced an overbought reading since April 21st.
- Regional manufacturing surveys had the strongest showing for price indices since the spring of 2022.
- Special questions from regional Federal Reserve bank surveys indicated rising prices and decelerating AI adoption among responding firms.
See today’s full post-market Closer and everything else Bespoke publishes by starting a 14-day trial to Bespoke Institutional today!
May 27, 2026
Bespoke’s Conference Call Recaps use AI to summarize lengthy earnings calls. The commentary below is AI-generated and then edited by Bespoke for quality control. As always, none of these summaries should be construed as recommendations to buy or sell any securities, and investors should do their own research and/or consult with a financial professional before making any investment decisions.
Our latest recap available to Bespoke subscribers covers Modine (MOD) Q4 2026 earnings call.

Modine Manufacturing (MOD) makes thermal management equipment, most importantly the chillers, cooling units, and air handlers that keep data centers from overheating. It has become one of the most direct ways to invest in AI infrastructure buildout. This was a landmark quarter as MOD made a $4 billion long-term agreement with an existing data center customer to supply chillers from 2027 through 2029, with no more than $2 billion in any single year. Management raised its fiscal 2027 data center growth forecast to 60% to 80% and reaffirmed a 50% to 70% CAGR for fiscal 2028, implying a data center business approaching $3 billion or more. The company also closed the year with record order intake for the second straight quarter. Component shortages hit late in Q4 and will weigh on Q1 production, though management says it won’t affect the full year. Tariffs are a headwind but manageable, with cost recovery mechanisms in place and a typical 3 to 6 month lag. The pending spin-off of its legacy vehicle thermal business into Gentherm remains on track to close by year’s end. MOD reported a triple play; however, shares are down over 6.5% on the day…
Continue reading our Conference Call Recap for MOD by becoming a Bespoke Institutional subscriber. You can sign up for Bespoke Institutional now and receive a 14-day trial to read our newest Conference Call Recap. To sign up, choose either the monthly or annual checkout link below:
Bespoke Institutional – Monthly Payment Plan
Bespoke Institutional – Annual Payment Plan
May 27, 2026
Bespoke’s Conference Call Recaps use AI to summarize lengthy earnings calls. The commentary below is AI-generated and then edited by Bespoke for quality control. As always, none of these summaries should be construed as recommendations to buy or sell any securities, and investors should do their own research and/or consult with a financial professional before making any investment decisions.
Our latest recap available to Bespoke subscribers covers DICK’S Sporting Goods (DKS) Q1 2026 earnings call.
DICK’S Sporting Goods (DKS) is the largest sporting goods retailer in the US, selling everything from cleats and golf clubs to trading cards and licensed gear. Its acquisition of Foot Locker last year made it a global sports retail powerhouse, and its results offer one of the clearest reads on how the American sports consumer is spending. The core DICK’S business put up a 6% comp on top of a 4.5% comp last year, with no signs of trade-down across income levels and 1.5 million new customers added in the quarter alone. On the Foot Locker side, the turnaround is ahead of schedule. The US Foot Locker banner comped up 6.4%, and the Fast Break refresh, which basically declutters the shoe wall and brings apparel back, is delivering double-digit comps across its first 100 locations. The one soft spot was gross margin, dinged by higher fuel costs, startup costs from a new distribution center, and the fast-growing but lower-margin trading cards business. Despite better-than-expected results, shares opened more than 3% lower on 5/27…
Continue reading our Conference Call Recap for DKS by becoming a Bespoke Institutional subscriber. You can sign up for Bespoke Institutional now and receive a 14-day trial to read our newest Conference Call Recap. To sign up, choose either the monthly or annual checkout link below:
Bespoke Institutional – Monthly Payment Plan
Bespoke Institutional – Annual Payment Plan
May 27, 2026
See what’s driving market performance around the world in today’s Morning Lineup. Bespoke’s Morning Lineup is the best way to start your trading day. Read it now by starting a two-week trial to Bespoke Premium. CLICK HERE to learn more and start your trial.
“Every victory is only the price of admission to a more difficult problem” – Henry Kissinger

Below is a snippet of commentary from today’s Morning Lineup. Start a two-week trial to Bespoke Premium to view the full report.
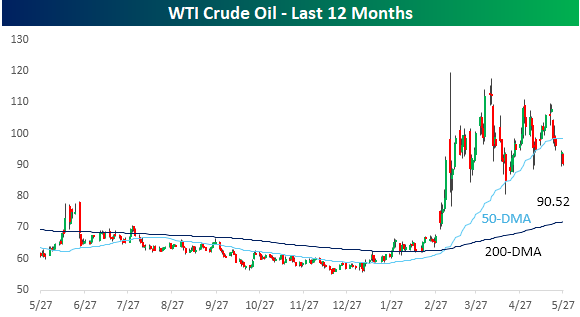
S&P 500 futures are modestly higher (+0.27%), while Nasdaq leads (+0.79%) as memory stocks surge again in pre-market trading. Crude oil is down over 4%, right around $90 per barrel, on hopes (again) of a resolution to the war in Iran and the closure of the Strait of Hormuz. The 10-year yield is down 3 bps to 4.46%, and gold is down another 1.2% to $4,450 per ounce.
It’s a quiet economic calendar this morning, with Richmond Fed the only report on the calendar, while several Fed officials are scheduled to speak. In Asia and Europe, markets were mixed, and the STOXX 600 is currently up 0.2%
As mentioned above, WTI crude briefly dipped below $90 per barrel this morning and now trades just above that level. Prices have been moving in an increasingly narrow range as the markets await a resolution to the war in Iran and the closure of the Strait of Hormuz. US markets have already rallied so much above their pre-war levels, so it’s hard to imagine seeing the US market get a major lift unless prices see a major decline from here. However, if prices continue to drift lower, we would expect to see a broadening of the rally, perhaps even at the expense of the mega caps.
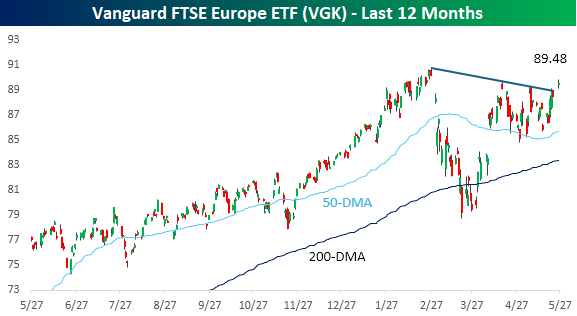
One area of the world more leveraged to oil prices is Europe. As shown below, the FTSE Europe ETF (VGK) has yet to take out its high from earlier in the year, but the drop in oil prices this morning has it getting closer. With this morning’s rally, the ETF is also breaking its downtrend from its earlier peak, leaving one less roadblock to clear on the road to new highs.
On a final note, here we go again. Whenever a new trend emerges in the market, you always find irrelevant companies looking to exploit the wave of euphoria by ‘rebranding’ their businesses to capitalize on the wave of investor interest. In the late 1990s, we saw it with dot-com companies. Then, about 10 years ago, penny stocks started adding crypto to their name in hopes of getting a pop in their share prices.
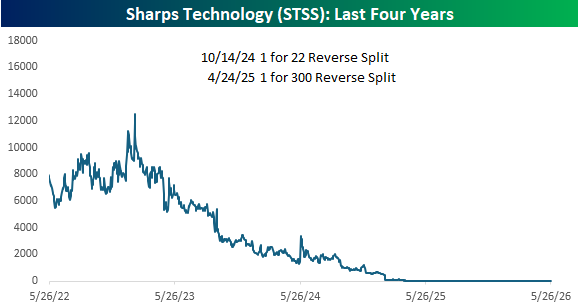
Recently, the “it” rebranding strategy is AI, and the latest example this morning is a company called Sharps Technology (SSTS). For years, Sharps Technology could generously be described as a medical device company in that they made medical syringes. In 2025, the company “pivoted” towards crypto, essentially becoming a Solana treasury company and holding as much as $250 million in the cryptocurrency on its balance sheet.
Judging by the company’s stock price, the pivot to crypto didn’t go as planned, as the price of STSS stock has been in a steady free-fall for several years now. On a reverse-split adjusted basis, the stock has gone from around $16,000 to $1.82 yesterday. It’s been like a memory stock, but only in reverse!
Often, a reverse stock split, even if it’s on a 1-2 basis, is a sign of trouble at a company. STSS has announced two reverse stock splits in the last four years. In October 2024, the company announced a 1 for 22 reverse split, and if that wasn’t bad enough, six months later, it announced a 1 for 300 split. If our math is correct, for every 6,600 shares you had in the summer of 2024, you have one now!
Since the crypto strategy hasn’t quite worked out for Sharps, today the company is going in a new direction and announced a new “vision to build the leading Agentic Finance Platform for the Global South.” The company will change its name to SkyAI and combine its “stablecoin rails with agentic AI to deliver financial access, education, and actionable intelligence to the billions of underbanked users across Africa, Latin America, and Southeast Asia.”
Whenever you see these types of stories, it immediately brings bubble talk into the conversation, and rightfully so. The one silver lining to all of this, at least at this point, is that the announcement has been largely ignored as shares of STSS are up merely six cents in pre-market trading.
Start a two-week trial to Bespoke Premium to continue reading today’s full Morning Lineup.
May 26, 2026
Log-in here if you’re a member with access to the Closer.
- DRAM prices and GPU rental rates have continued to rise, powering the AI trade.
- AI related stocks have posted consistent gains recently with many of those names reaching new highs.
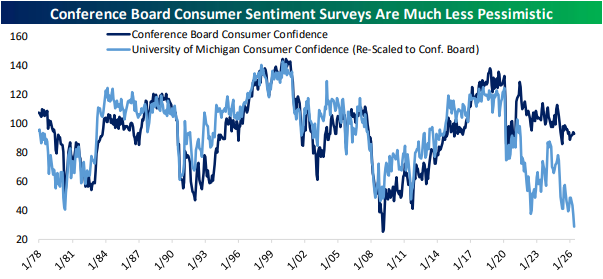
- Separate surveys tracking consumer confidence are showing drastically different results including a record low for UMich and more tempered readings for the Conference Board.
See today’s full post-market Closer and everything else Bespoke publishes by starting a 14-day trial to Bespoke Institutional today!
May 26, 2026
See what’s driving market performance around the world in today’s Morning Lineup. Bespoke’s Morning Lineup is the best way to start your trading day. Read it now by starting a two-week trial to Bespoke Premium. CLICK HERE to learn more and start your trial.
“You’re short on ears and long on mouth.” – John Wayne
Below is a snippet of commentary from today’s Morning Lineup. Start a two-week trial to Bespoke Premium to view the full report.
The headlines over the weekend regarding the status of the war in Iran have been conflicting, but markets are taking the optimistic side. S&P 500 and Nasdaq futures were both firmly higher to kick off the holiday-shortened week. The S&P 500 is on pace to open at a new record high with a gain of 0.70%, while Nasdaq futures are up my more than 1%. European and Asian markets were mostly lower overnight, but that’s because they were open yesterday and saw broad gains.
Outside of equities, the 10-year yield is down 9 basis points and back below 4.5%, while crude oil is down 4% to $92.66, although it was down more over the weekend.
Here in the US today, we’re largely done with earnings season, but on the economic calendar, we’ll get house price data at 9 AM easter, Consumer Confidence at 10 AM, and the Dallas Fed Manufacturing Index at 10:30.
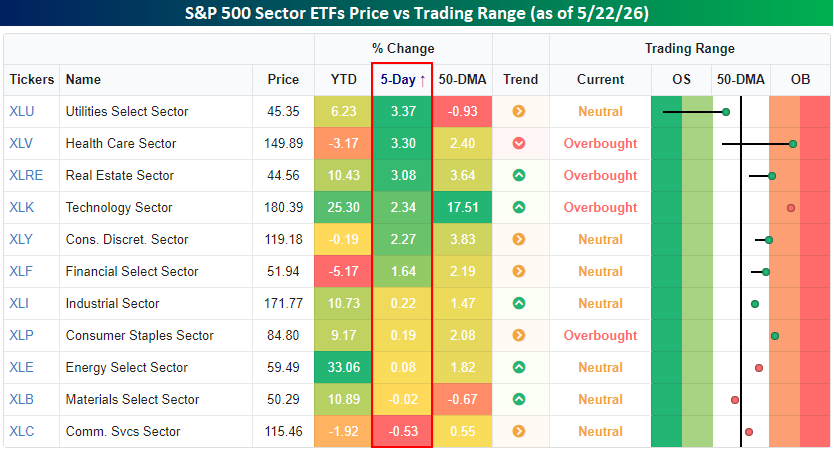
After the long weekend, we wanted to provide a quick recap of market performance heading into the holiday. The S&P 500 was up less than 1% for the week, but breadth was positive as three sectors rallied more than 3%, and another three rallied more than 1%. The only sectors that traded lower were Communication Services and Materials, which were both down less than 1%.
In terms of where sectors are trading compared to their trading ranges, four finished the week at overbought levels, while every other sector was neutral. Utilities and Materials are also the only sectors that headed into the weekend below their 50-day moving averages, but Utilities at least moved out of extreme oversold territory.
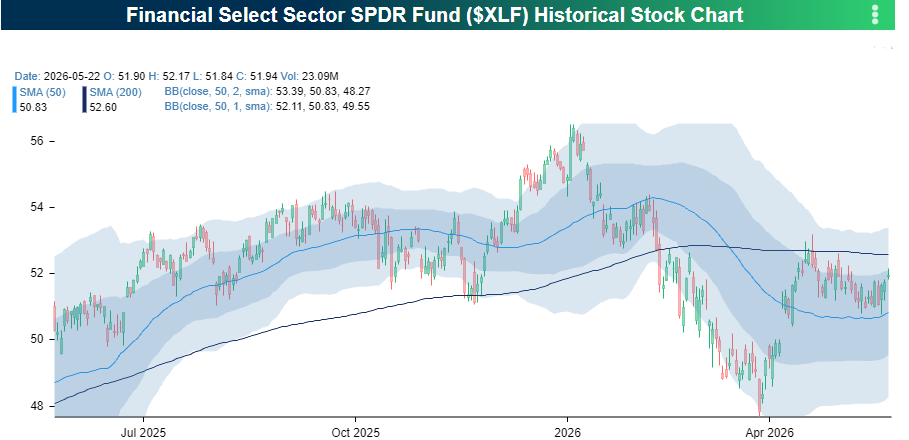
On a YTD basis, Financials has been the worst-performing sector with a decline of just over 5%. As shown in the chart below, the sector ETF finished the week right between its 50 and 200-DMAs. The 50-DMA, which has recently been acting as support, also coincides with longer-term support in the low 50s.
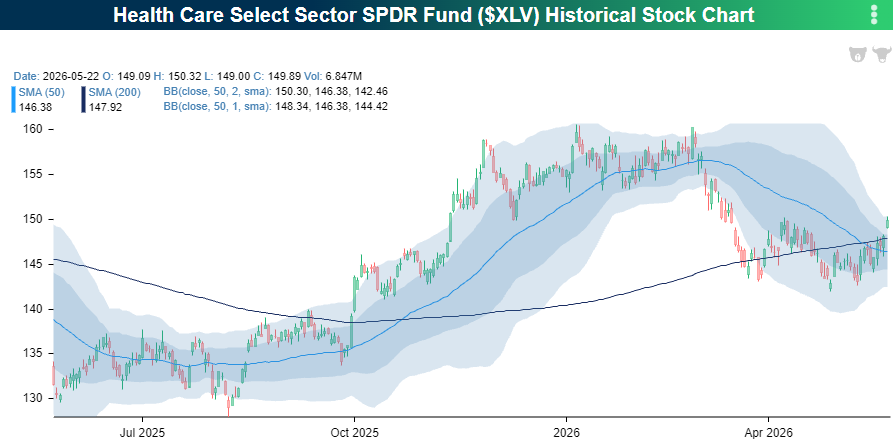
Health Care has been another laggard this year, but has recently shown some signs of life. After holding support in the low $140 range for the last few weeks, the sector broke out of a short-term trading range to close out the week and closed above both its 50 and 200-DMA for the first time in several weeks. Health Care has been out of favor for a long time now, but there’s a lot of runway for the sector between current levels and the high from earlier this year.
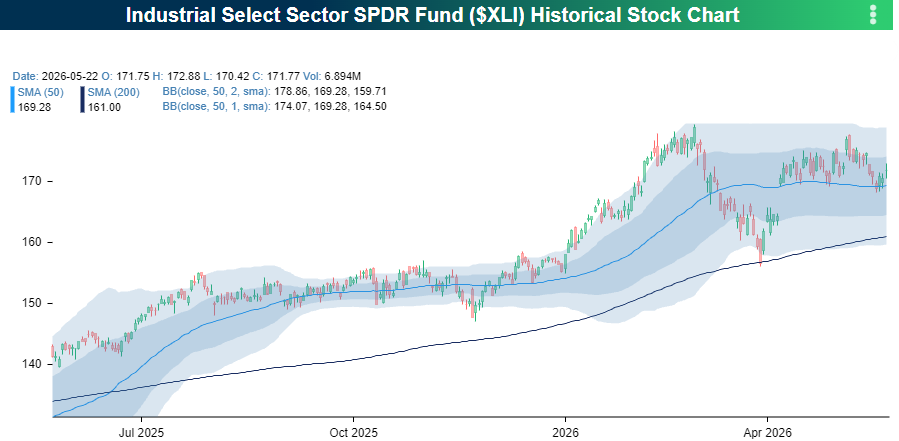
Finally, Industrials were a laggard last week, and along with other sectors, still have yet to trade to a new high. As shown in the chart below, though, the sector is getting close. XLI has traded in a sideways range for more than a month now, with downside support at the 50-DMA and upside resistance at the highs from earlier in the year. If the headlines are right and the Iran war is close to an end, the resistance may start to weaken.
Start a two-week trial to Bespoke Premium to continue reading today’s full Morning Lineup.