May 29, 2026
Bespoke’s Conference Call Recaps use AI to summarize lengthy earnings calls. The commentary below is AI-generated and then edited by Bespoke for quality control. As always, none of these summaries should be construed as recommendations to buy or sell any securities, and investors should do their own research and/or consult with a financial professional before making any investment decisions.
Our latest recap available to Bespoke subscribers covers Kohl’s (KSS) Q1 2026 earnings call.

Kohl’s (KSS) is a mid-tier department store chain with roughly 1,100 locations serving low-to-middle income shoppers across the US. It sells apparel, footwear, home goods, and beauty through its own private labels and national brands, with Sephora shop-in-shops as a key traffic driver. This was the best quarterly comp in four years, down just 1.1%, and management is cautiously optimistic. The clearest win was private label brands, up 6%, driven by juniors’ clothing brand “So” and activewear brand “Flex,” both resonating strongly with value-seeking customers. The Kohl’s card customer, historically the most loyal and productive cohort, went from down mid-single digits in Q4 to flat in Q1, a 600 basis point swing that suggests the turnaround is gaining real traction. Sephora was the one notable disappointment, running down low single digits with weakness in makeup and skincare, though MAC, a cosmetics brand, is rolling out to all stores later this year. Store traffic is still declining, and getting customers back more frequently remains the central challenge. Kohls’s rallied 20% on 5/28 after beating both EPS and revenue expectations…
Continue reading our Conference Call Recap for KSS by becoming a Bespoke Institutional subscriber. You can sign up for Bespoke Institutional now and receive a 14-day trial to read our newest Conference Call Recap. To sign up, choose either the monthly or annual checkout link below:
Bespoke Institutional – Monthly Payment Plan
Bespoke Institutional – Annual Payment Plan
May 29, 2026
Bespoke’s Conference Call Recaps use AI to summarize lengthy earnings calls. The commentary below is AI-generated and then edited by Bespoke for quality control. As always, none of these summaries should be construed as recommendations to buy or sell any securities, and investors should do their own research and/or consult with a financial professional before making any investment decisions.
Our latest recap available to Bespoke subscribers covers Salesforce’s (CRM) Q1 2027 earnings call.
Salesforce (CRM) is the world’s largest customer relationship management software company, providing cloud-based tools for sales, customer service, marketing, data analytics, commerce, and workplace collaboration through Slack. Salesforce now processes 28.6 trillion AI tokens quarterly and said Agentforce ARR surpassed $1 billion, highlighting how quickly large enterprises are experimenting with autonomous AI tools. This quarter’s earnings call focused almost entirely on AI monetization and Salesforce’s push to become the “operating system” for enterprise agents. Management repeatedly emphasized that customers are moving beyond pilots into production deployments, with companies like PenFed and UCLA Health using AI agents to reduce call center workloads, automate patient inquiries, and consolidate sprawling software systems. Slack was another major focus, with management calling it the central workspace for both humans and AI agents as Slack AI usage surged 350% quarter-over-quarter. Salesforce also introduced “Headless 360,” allowing AI tools like Claude and ChatGPT to access Salesforce data directly through MCP APIs. After posting better-than-expected EPS and revenue, CRM shares fell 0.75% on 5/28…
Continue reading our Conference Call Recap for CRM by becoming a Bespoke Institutional subscriber. You can sign up for Bespoke Institutional now and receive a 14-day trial to read our newest Conference Call Recap. To sign up, choose either the monthly or annual checkout link below:
Bespoke Institutional – Monthly Payment Plan
Bespoke Institutional – Annual Payment Plan
May 29, 2026
Bespoke’s Conference Call Recaps use AI to summarize lengthy earnings calls. The commentary below is AI-generated and then edited by Bespoke for quality control. As always, none of these summaries should be construed as recommendations to buy or sell any securities, and investors should do their own research and/or consult with a financial professional before making any investment decisions.
Our latest recap available to Bespoke subscribers covers Best Buy (BBY) Q1 2027 earnings call.

Best Buy (BBY) is the largest consumer electronics retailer in the US, selling everything from laptops and TVs to appliances and gaming gear. Comps came in at 2%, ahead of the 1% guide, with broad-based strength across gaming, computing, and mobile. The consumer picture remains consistent: value-focused but still willing to spend, with no signs of trade-down. The biggest news was a one-year national exclusive on RGB TVs, the first major new display technology since OLED in 2013, arriving just as the 49 million TVs sold during 2020 enter their replacement window. On the cost side, rising DRAM prices are pushing up PC prices industry-wide, but Best Buy is pulling inventory forward to lock in lower costs and betting its broad assortment will keep customers shopping within their budgets. Best Buy Ads is approaching $1 billion in annual revenue, and Marketplace hit $250 million GMV in the quarter alone. CEO Corie Barry also announced she is stepping down in November, with incoming CEO Jason Bonfig taking over. Best Buy’s share price is up nearly 18% after EPS and revenue beat expectations…
Continue reading our Conference Call Recap for BBY by becoming a Bespoke Institutional subscriber. You can sign up for Bespoke Institutional now and receive a 14-day trial to read our newest Conference Call Recap. To sign up, choose either the monthly or annual checkout link below:
Bespoke Institutional – Monthly Payment Plan
Bespoke Institutional – Annual Payment Plan
May 28, 2026
Log-in here if you’re a member with access to the Closer.
- Even after working off of its lows, the S&P 500 Software and Services industry’s distance from its price targets is in the 10th percentile of all periods since 2003.
- GDP was revised down 0.4%-pt QoQ SAAR as non-residential investment remained the biggest driver of growth.
- Due to a combination of weak hiring, slowing wage growth, and higher inflation, purchasing power has been driven down as real household earnings registered a 4th percentile reading.
See today’s full post-market Closer and everything else Bespoke publishes by starting a 14-day trial to Bespoke Institutional today!
May 28, 2026
The “Bespoke 50” is a basket of noteworthy growth stocks in the Russell 3,000. To make the list, a stock must have strong earnings growth prospects along with an attractive price chart based on Bespoke’s analysis. There were eight changes to the list this month.
The Bespoke 50 is available with a Bespoke Premium subscription or a Bespoke Institutional subscription. With Bespoke Premium, you’ll receive a number of daily market updates from us along with our weekly newsletter and a portion of our investor tools. With Bespoke Institutional, you’ll receive everything that’s included with Premium plus additional daily macro analysis and more stock-specific research.
To see all 50 stocks that currently make up the Bespoke 50, simply start a two-week trial to Bespoke Premium or Bespoke Institutional.
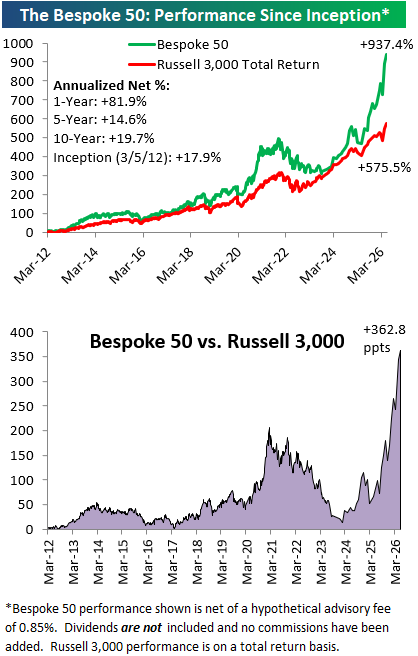
The Bespoke 50 performance chart shown does not represent actual investment results. The Bespoke 50 is updated monthly on Thursdays unless otherwise noted. Performance is based on equally weighting each of the 50 stocks (2% each) and is calculated using each stock’s opening price as of Friday morning after publication. Entry prices and exit prices used for stocks that are added or removed from the Bespoke 50 are based on Friday’s opening price. Any potential commissions, brokerage fees, or dividends are not included in the Bespoke 50 performance calculation, but the performance shown is net of a hypothetical annual advisory fee of 0.85%. Performance tracking for the Bespoke 50 and the Russell 3,000 total return index begins on March 5th, 2012 when the Bespoke 50 was first published. Past performance is not a guarantee of future results. The Bespoke 50 is meant to be an idea generator for investors and not a recommendation to buy or sell any specific securities. It is not personalized advice because it in no way takes into account an investor’s individual needs. As always, investors should conduct their own research when buying or selling individual securities. Click here to read our full disclosure on hypothetical performance tracking. Bespoke representatives or wealth management clients may have positions in securities discussed or mentioned in its published content.
May 28, 2026
See what’s driving market performance around the world in today’s Morning Lineup. Bespoke’s Morning Lineup is the best way to start your trading day. Read it now by starting a two-week trial to Bespoke Premium. CLICK HERE to learn more and start your trial.
“The distance between insanity and genius is measured only by success” – Ian Fleming

Below is a snippet of commentary from today’s Morning Lineup. Start a two-week trial to Bespoke Premium to view the full report.
Markets are taking a breather this morning as the US and Iran trade missile and drone strikes. The S&P 500 looks poised to open 0.2% lower, while the Nasdaq is down 0.33%. After a brief excursion below $90, WTI crude oil is back above $90, gold is down over 1%, and the 10-year yield is up 3 bps to 4.51%.
Asian stocks were mostly lower overnight, with the Nikkei down 0.5% and Hong Kong falling 1.3%. The Shanghai Composite bucked the trend, finishing with a marginal gain, but even South Korea finished the session lower, falling 0.5%. South Korea down? Outside of the rising tensions between the US and Iran, there was no obvious catalyst for the declines in the region.
In Europe, events in the Middle East have also weighed on equities. The STOXX 600 is down close to 1%. Led lower by the UK, while Italy bucks the trend with a gain. Hawkish comments from the ECB’s Chief Economist also haven’t helped.
In the US today, there’s a monster slate of data on the calendar with Personal Income, Personal Spending, PCE, Jobless Claims, Durable Goods, and GDP all at 8:30, followed by New Homes Sales at 10 AM, as well as Energy inventories at 10:30 and 12:00.
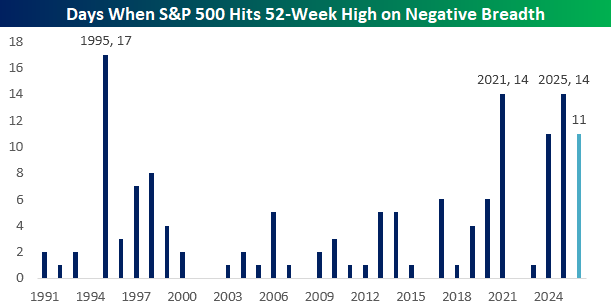
Yesterday was another one of those days when the S&P 500 hit a 52-week high, but breadth was negative. So far this year, these types of daily divergences have occurred 11 times, and if that brings back memories of the late 1990s, it shouldn’t.
As shown in the chart below, we’re not even fully five months into the year, but this year already ranks tied for fourth in the number of days when the S&P 500 closed at a 52-week high but breadth was negative. The only years with more occurrences were 1995 (17), 2021, and 2025, with 14. If you look at the late 1990s, though, in 1998 it happened only eight times all year, in 1999 there were only four occurrences, and in 2000, it only happened twice.
Regarding breadth, the S&P 500’s cumulative advance/decline line continues to diverge from price. On 4/20, the cumulative A/D line made a marginal new high, but ever since then, it’s been biased to the downside, even as the S&P 500 has rallied close to 6%.
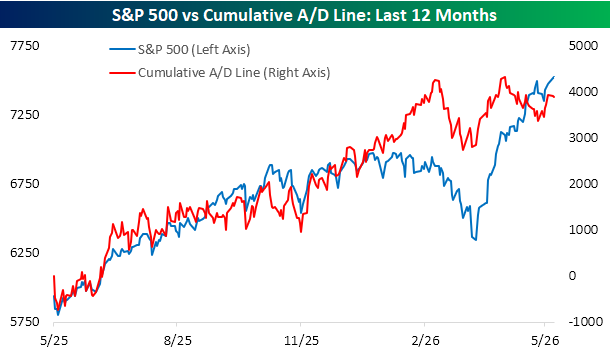
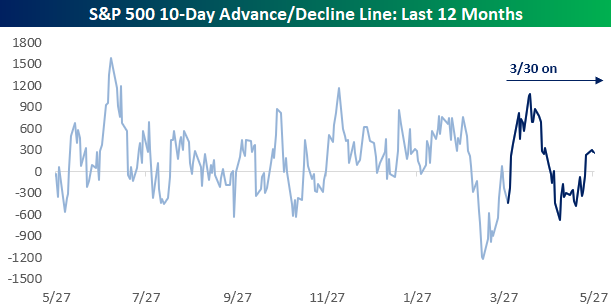
At least there have been some signs that breadth is modestly improving. The chart below shows the S&P 500’s 10-day A/D line over the last year, with the period from 3/30 shown in dark blue. While breadth was positive in the early days of the rally, from late April through just before Memorial Day weekend, it was negative before moving modestly back into positive territory this week. Breadth could still use a lot of improvement, but you have to start somewhere!
Start a two-week trial to Bespoke Premium to continue reading today’s full Morning Lineup.