May 22, 2026
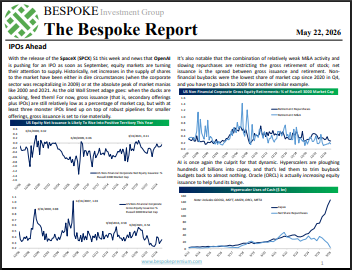
To read our weekly Bespoke Report newsletter and access everything else Bespoke’s research platform offers, start a two-week trial to Bespoke Premium. In this week’s report we look at the looming US equity supply. In addition to reduced buybacks driven by the AI capex boom, three mega IPOs are likely to price this year including SpaceX (SPCX). We review their S-1 as well as some implications for index investing. The AI trade is alive and well, and we look at how it’s impacting foreign markets, US earnings, and breadth in the domestic equity market. We also discuss commodities, interest rates, and notable US economic data released this week. Give it a read!

May 22, 2026
See what’s driving market performance around the world in today’s Morning Lineup. Bespoke’s Morning Lineup is the best way to start your trading day. Read it now by starting a two-week trial to Bespoke Premium. CLICK HERE to learn more and start your trial.
“Great ideas come from everywhere if you just listen and look for them.” – Sam Walton

Below is a snippet of commentary from today’s Morning Lineup. Start a two-week trial to Bespoke Premium to view the full report.
If you don’t cut out early for the holiday weekend, make sure to check out Paul Hickey on Making Money with Charles Payne today at 2 PM.
The S&P 500 is looking to extend its streak of gains to eight weeks, and futures are cooperating so far. Both the Nasdaq and S&P 500 are indicated to open 0.15% higher, although they’ve given up much of their earlier gains as crude oil rallies about 2%. Treasury yields are lower, although the 10-year yield still sits above 4.55%. Gold and Bitcoin are both down about 0.5%.
It was another positive session in Asia, as the Nikkei rallied 2.7%, taking its weekly gain to 3.1%, while South Korea rallied 0.4% to finish nearly 5% higher for the week. Chinese stocks also traded up, with the Shanghai Composite rallying 0.9% but still finishing modestly lower for the week.
The catalyst for last night’s rally was weaker-than-expected April CPI, with core rising 1.4% y/y relative to expectations for 1.7%. Also, in South Korea, the index of Consumer Confidence for May jumped from 99.2 to 106.1.
It’s been a broadly positive day for equities in Europe. The STOXX 600 is up 0.5%, taking its weekly gain to more than 2.5%. Germany is leading the way for the week with a gain of 3.4%, while Italy is up less than half a percent. These gains come despite some hawkish commentary from ECB officials concerning inflation.
The only economic report on the US calendar this morning is the Michigan Sentiment report, which continues to hang around near all-time lows even as the stock market sits near all-time highs. Also, since it’s the Friday before a holiday weekend, the bond market closes at 2 PM today, so look for activity to really dry up in the afternoon.
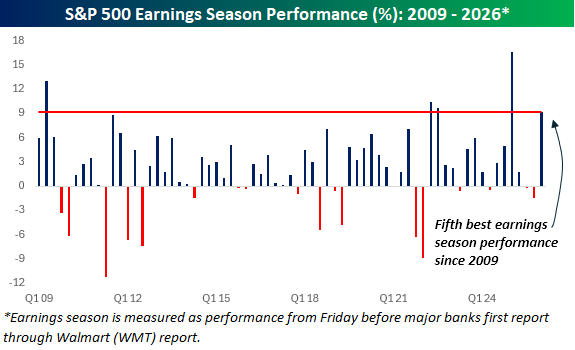
Earnings season came to an unofficial end with Walmart’s (WMT) report on Thursday, and what an earnings season it was. Heading into the reporting period, we highlighted the pace of negative revisions as a bullish contrarian signal, and it played out, as results and guidance both came in much better than expected.
From April 10th through yesterday’s close, the S&P 500 gained 9.2%, which ranked as the best earnings season (Friday before the first large banks start to report through WMT) since the same reporting period last year, coming out of the tariff-tantrum. Back then, it was a similar backdrop; amidst tariff uncertainty, companies had little incentive to give upbeat outlooks, but that’s exactly what we saw. This earnings season saw a similar story unfold, with the main difference being that tariff uncertainty was swapped out and replaced with the war in Iran.
The chart below shows the S&P 500’s performance during earnings seasons since the start of 2009, and while the market rallies an average of 2.2% during earnings season, the 9.2% gain during this earnings season ranks as the fifth best since the start of 2009. The only better ones were coming out of the financial crisis, two quarters coming out of the 2022 bear market, and finally, the Q1 earnings season last year.
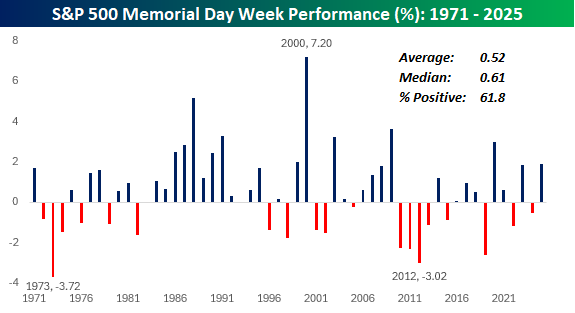
Looking ahead, coming out of the unofficial start to summer next week, the S&P 500’s historical performance in the week after Labor Day has been a gain of 0.52% (median: 0.61%) with positive returns 61.8% of the time. The best post-Memorial Day week was a gain of 7.2% in 2000, which turned out to be a major false alarm, while the only two years when the S&P 500 declined 3%+ during the week were in 1973 and 2012.
Start a two-week trial to Bespoke Premium to continue reading today’s full Morning Lineup.
May 21, 2026
Log-in here if you’re a member with access to the Closer.
- One source of inflation that has not eased is beef prices as live cattle futures currently sit near records of $2.40/lb.
- US flash PMIs from S&P Global were stronger than international peers, especially for the manufacturing sector.
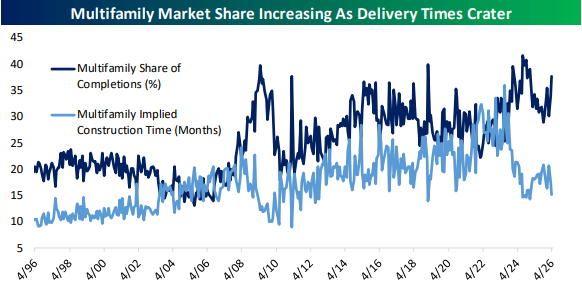
- While the single-family housing market remains challenged by high rates, multifamily starts are +20% YoY and at new cycle highs.
See today’s full post-market Closer and everything else Bespoke publishes by starting a 14-day trial to Bespoke Institutional today!
May 21, 2026
Bespoke’s Conference Call Recaps use AI to summarize lengthy earnings calls. The commentary below is AI-generated and then edited by Bespoke for quality control. As always, none of these summaries should be construed as recommendations to buy or sell any securities, and investors should do their own research and/or consult with a financial professional before making any investment decisions.
Our latest recap available to Bespoke subscribers covers Walmart (WMT) Q1 2027 earnings call.

Walmart (WMT) is the world’s largest retailer, with over 10,900 stores and clubs worldwide including Walmart, Sam’s Club, and Flipkart in India. Because it sells almost everything to everyone, it’s one of the best windows into how the everyday consumer is actually doing. The biggest story this quarter was the growing divide between shoppers. Lower-income customers are clearly feeling the pinch. The average gas fill-up at Walmart stations fell below 10 gallons for the first time since 2022. Higher-income households, meanwhile, are spending without much hesitation. Walmart absorbed $175M in surprise fuel costs yet still held its full-year guidance. Online sales grew 26%, the US third-party marketplace was up nearly 50%, and Walmart can now deliver to 60% of the country in 30 minutes or less. Its AI shopping tool, Sparky, more than doubled active users in just one quarter, and shoppers using it spend 35% more per order. Advertising and membership now make up roughly a third of total earnings, growing 37% and 17% respectively. WMT shares are down approximately 7% today after reporting better-than-expected revenue and in-line EPS…
Continue reading our Conference Call Recap for WMT by becoming a Bespoke Institutional subscriber. You can sign up for Bespoke Institutional now and receive a 14-day trial to read our newest Conference Call Recap. To sign up, choose either the monthly or annual checkout link below:
Bespoke Institutional – Monthly Payment Plan
Bespoke Institutional – Annual Payment Plan
May 21, 2026
Bespoke’s Conference Call Recaps use AI to summarize lengthy earnings calls. The commentary below is AI-generated and then edited by Bespoke for quality control. As always, none of these summaries should be construed as recommendations to buy or sell any securities, and investors should do their own research and/or consult with a financial professional before making any investment decisions.
Our latest recap available to Bespoke subscribers covers Toll Brothers’ (TOL) Q2 2026 earnings call.

Toll Brothers (TOL) builds luxury homes and master-planned communities across the US, serving affluent move-up, first-time luxury, and active-adult buyers. The company stands out for its high-end locations and large Design Studio upgrade business. Toll also offers insight into upper-income consumer health, housing demand at the luxury end of the market, land competition, and how wealthy buyers are reacting to rates, stock market volatility, and economic uncertainty. TOL beat revenue and EPS estimates in a housing market most builders still describe as difficult. Management said affluent buyers remain resilient thanks to stock market gains, home equity, and wage growth, with 23% of buyers paying all cash and mortgage Loan-to-Values (LTVs) averaging just 69%. Florida and Austin were standout markets, including a West Palm Beach community selling $3 million homes at a $2 million monthly pace with low-30% gross margins. The company also highlighted progress in reducing finished spec inventory by 28%, selling homes earlier in construction to drive more high-margin Design Studio spending. On better-than-expected results, TOL shares rose 8.5% on 5/20…
Continue reading our Conference Call Recap for TOL by becoming a Bespoke Institutional subscriber. You can sign up for Bespoke Institutional now and receive a 14-day trial to read our newest Conference Call Recap. To sign up, choose either the monthly or annual checkout link below:
Bespoke Institutional – Monthly Payment Plan
Bespoke Institutional – Annual Payment Plan
May 21, 2026
Bespoke’s Conference Call Recaps use AI to summarize lengthy earnings calls. The commentary below is AI-generated and then edited by Bespoke for quality control. As always, none of these summaries should be construed as recommendations to buy or sell any securities, and investors should do their own research and/or consult with a financial professional before making any investment decisions.
Our latest recap available to Bespoke subscribers covers CAVA’s (CAVA) Q1 2026 earnings call.

CAVA (CAVA) operates one of the fastest-growing restaurant concepts in the US, serving customizable Mediterranean bowls, pitas, salads, dips, and proteins through a fast-casual format that prides itself on healthier options and convenience without heavy discounting. The company has become a standout traffic story in restaurants by attracting both higher-income customers trading up to premium items like steak and salmon, and lower-income customers still willing to spend for fresher food and perceived value. CAVA reported 9.7% same-store sales growth driven by 6.8% traffic growth, while many peers continue reporting sluggish consumer demand. Management said strength remained broad across regions and income groups, with lower-income consumers actually outperforming despite macro uncertainty and rising fuel costs. The company said new restaurants are opening above 100% productivity with $3 million AUVs and highlighted strong guest response to white sweet potatoes and its new nationwide salmon launch. Executives also emphasized investments in labor, hospitality, loyalty engagement, and internally built AI and data systems aimed at predictive prep, staffing, and personalized marketing. Shares were up 3% on 5/20 in reaction to EPS and revenue beats…
Continue reading our Conference Call Recap for CAVA by becoming a Bespoke Institutional subscriber. You can sign up for Bespoke Institutional now and receive a 14-day trial to read our newest Conference Call Recap. To sign up, choose either the monthly or annual checkout link below:
Bespoke Institutional – Monthly Payment Plan
Bespoke Institutional – Annual Payment Plan