Mar 15, 2016
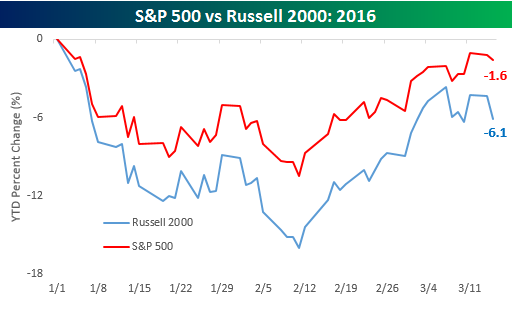
In today’s Chart of the Day sent to all of our subscribers, we take a look at the remarkable consistency with which the Russell 2000 small cap index has underperformed the large-cap S&P 500 so far this year. We then looked at other times when small caps started out the year with consistent underperformance to start off a year and how they performed for the remainder of the year.
To continue reading our Chart of the Day, enter your info below and start a free Bespoke research trial. During your trial, you’ll also receive access to our model stock portfolios, daily market alerts, and weekly Bespoke Report newsletter.
[thrive_leads id=’59052′]
Mar 14, 2016
In today’s Chart of the Day sent to all of our subscribers, we take a look at an extremely high breadth reading that registered for the S&P 500 last Friday and what it means for the market in the days and months ahead. As of Friday’s close, 89% of stocks in the S&P 500 were above their 50-day moving averages. Is this bullish or bearish for the near and long-term outlook for stocks?

To continue reading our Chart of the Day, enter your info below and start a free Bespoke research trial. During your trial, you’ll also receive access to our model stock portfolios, daily market alerts, and weekly Bespoke Report newsletter.
[thrive_leads id=’59052′]
Mar 11, 2016
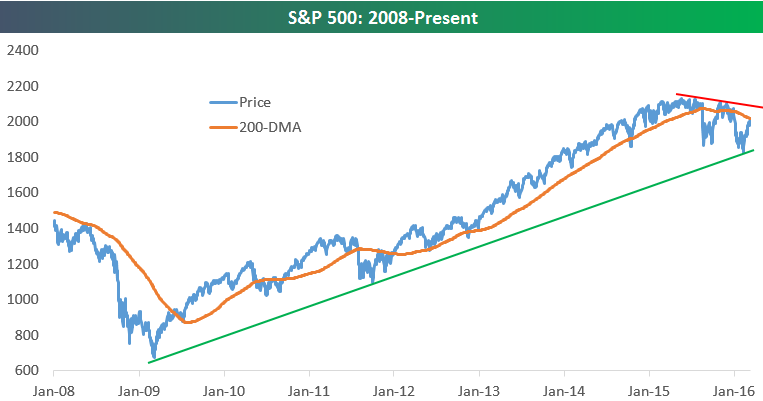
In today’s Chart of the Day sent to all of our subscribers, we analyze the long-term bull market pattern for the S&P 500 shown below, plus we take a look at the best times to own the market by day of the week so far this year.
To continue reading our Chart of the Day, enter your info below and start a free Bespoke research trial. During your trial, you’ll also receive access to our model stock portfolios, daily market alerts, and weekly Bespoke Report newsletter.
[thrive_leads id=’59052′]
Mar 10, 2016
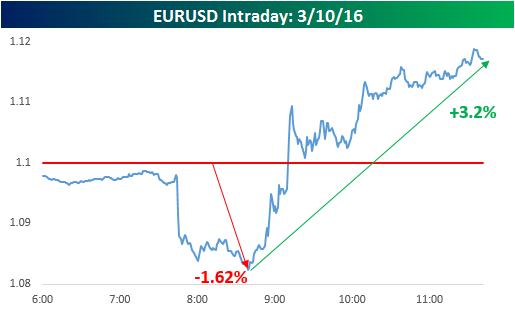 Take a look at the chart to the right because you don’t see reversals like this very often. After trading down as much as 1.62% on an intraday basis following the release of the ECB statement at 7:45 eastern time, the Euro bottomed relative to the dollar shortly after Mario Draghi began speaking at 8:30. Since then, it has rallied more than 3%. In the history of the currency, there hasn’t been a single day where the Euro was down 1% intraday and rallied back more than 3% off that level.
In today’s Chart of the Day sent to all of our subscribers, we’ve identified prior reversals in the Euro similar to today and showed what the short-term impact was on the US equity market.
To continue reading our Chart of the Day, enter your info below and start a free Bespoke research trial. During your trial, you’ll also receive access to our model stock portfolios, daily market alerts, and weekly Bespoke Report newsletter.
[thrive_leads id=’59052′]
Mar 9, 2016
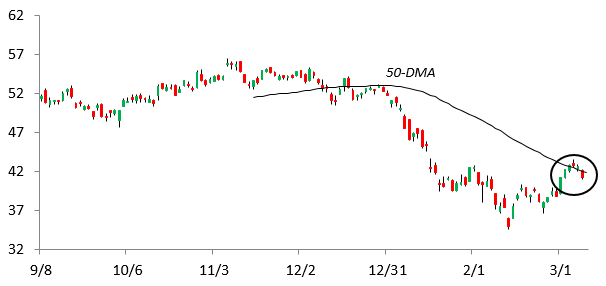
In today’s Chart of the Day sent to all of our subscribers, we’ve identified three key Financial stocks that have recently seen huge bounces off of their February lows but are now bumping up against resistance at their 50-day moving averages. Below is a chart of one of them with the ticker not shown.
To continue reading our Chart of the Day, enter your info below and start a free Bespoke research trial. During your trial, you’ll also receive access to our model stock portfolios, daily market alerts, and weekly Bespoke Report newsletter.
[thrive_leads id=’59052′]
Mar 8, 2016
Stocks and oil have both had remarkable runs over the last month, but have the rallies been strong enough to turn market technicals from negative to positive again? We take a look at the charts for the S&P 500, the Russell 2,000, the S&P 500 Energy sector, and the price of oil in today’s Chart of the Day sent to all of our subscribers.
To continue reading our Chart of the Day, enter your info below and start a free Bespoke research trial. During your trial, you’ll also receive access to our model stock portfolios, daily market alerts, and weekly Bespoke Report newsletter.
[thrive_leads id=’59052′]