Mar 7, 2016
The S&P 500’s gain of 3.5% over the first four trading days of March is the index’s fourth best start to March in its history! Historically, March has been a strong month for the market, but when it gets off to the kind of start it has gotten off to this year, does it have anything left in the tank for the remainder of the month? We’ve just run an analysis to see how the S&P has performed for the remainder of March when it has had strong starts like it has had this year. We cover it in today’s Chart of the Day sent to all of our subscribers.
To continue reading our Chart of the Day, enter your info below and start a free Bespoke research trial. During your trial, you’ll also receive access to our model stock portfolios, daily market alerts, and weekly Bespoke Report newsletter.
[thrive_leads id=’59052′]
Mar 3, 2016
Today’s Chart of the Day compares the recent rally in the S&P 500 Energy sector ETF relative to prior rallies since its 2014 peak.
To continue reading our Chart of the Day, enter your info below and start a free Bespoke research trial. During your trial, you’ll also receive access to our model stock portfolios, daily market alerts, and weekly Bespoke Report newsletter.
[thrive_leads id=’59052′]
Mar 2, 2016
Today’s Chart of the Day compares the recent paths of economic surprise indices for the US and Europe and how they have changed in the last several weeks.
To continue reading our Chart of the Day, enter your info below and start a free Bespoke research trial. During your trial, you’ll also receive access to our model stock portfolios, daily market alerts, and weekly Bespoke Report newsletter.
[thrive_leads id=’59052′]
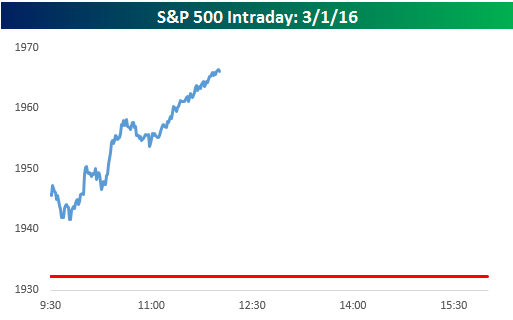
Mar 1, 2016
The S&P 500 rallied 1.76% in the first two and a half hours of trading today for its best morning since 8/27. In today’s Chart of the Day, we take a look at days where the S&P 500 was up 1.5% or more at noon and how the index performed for the remainder of the day.
To continue reading our Chart of the Day, enter your info below and start a free Bespoke research trial. During your trial, you’ll also receive access to our model stock portfolios, daily market alerts, and weekly Bespoke Report newsletter.
[thrive_leads id=’59052′]
Feb 29, 2016
In today’s Chart of the Day, we take a look at the frequency of all or nothing days in the S&P 500 so far this year and compare this year’s total to prior years since 1990.
To continue reading our Chart of the Day, enter your info below and start a free Bespoke research trial. During your trial, you’ll also receive access to our model stock portfolios, daily market alerts, and weekly Bespoke Report newsletter.
[thrive_leads id=’59052′]
Feb 26, 2016
Short interest levels for the middle of February were released earlier this week, and in today’s Chart of the Day, we take a look short interest levels in the Energy sector which approaching a critical level.
To continue reading our Chart of the Day, enter your info below and start a free Bespoke research trial. During your trial, you’ll also receive access to our model stock portfolios, daily market alerts, and weekly Bespoke Report newsletter.
[thrive_leads id=’59052′]