Mar 23, 2016
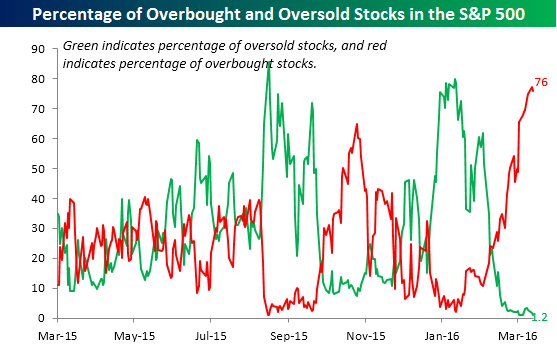
The chart below is from page two of our Morning Lineup report, which is available to all Bespoke Premium and Institutional clients. Today’s weakness in equities is sure to put some downward pressure on the percentage of overbought stocks, but in the wake of the big rally over the last six weeks, the net percentage of overbought (1+ standard deviation above 50-DMA) stocks in the S&P 500 surged above 75% earlier this week; the highest in over three years. In today’s Chart of the Day sent to all of our subscribers, we highlight the performance of the S&P 500 following other periods when the percentage of overbought stocks in the S&P 500reached similar levels as it did earlier this week.
To read our Chart of the Day, enter your info below and start a free Bespoke research trial. During your trial, you’ll also receive access to our model stock portfolios, daily market alerts, and weekly Bespoke Report newsletter.
[thrive_leads id=’59052′]
Mar 22, 2016
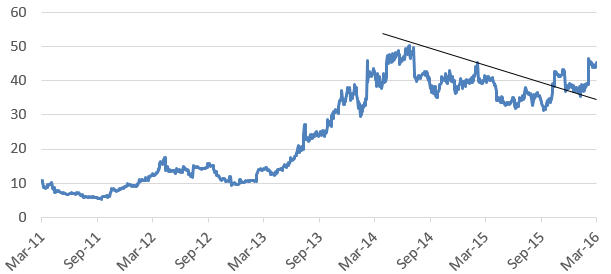
In today’s Chart of the Day sent to all of our subscribers, we highlight a new long opportunity in an individual name that has held up much better than other stocks in its sector over the last six months.
To read our Chart of the Day, enter your info below and start a free Bespoke research trial. During your trial, you’ll also receive access to our model stock portfolios, daily market alerts, and weekly Bespoke Report newsletter.
[thrive_leads id=’59052′]
Mar 17, 2016
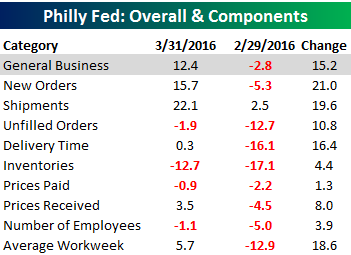
In today’s Chart of the Day sent to all of our subscribers, we discuss today’s ‘clean sweep’ in the Philly Fed report today (table right), and highlight when prior occurrences took place within the business cycle. We also summarize the performance of the S&P 500 in the months following each occurrence.
To continue reading our Chart of the Day, enter your info below and start a free Bespoke research trial. During your trial, you’ll also receive access to our model stock portfolios, daily market alerts, and weekly Bespoke Report newsletter.
[thrive_leads id=’59052′]
Mar 16, 2016
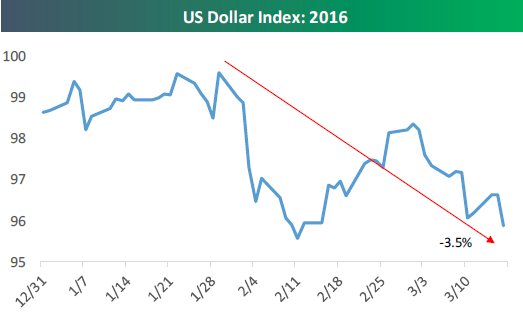
In today’s Chart of the Day sent to all of our subscribers, we take a look at the recent pullback in the US Dollar index and the impact it’s having on stocks and sectors. In a rising dollar environment, “domestic” stocks typically outperform. In a falling dollar environment, “international” stocks typically do better. Is that the case recently, and if so, will it continue?
To continue reading our Chart of the Day, enter your info below and start a free Bespoke research trial. During your trial, you’ll also receive access to our model stock portfolios, daily market alerts, and weekly Bespoke Report newsletter.
[thrive_leads id=’59052′]