Apr 28, 2016
The advance read on Q1 GDP will be released at 8:30 Eastern time, and with all the distortions to economic data that we have recently seen due to the early Easter, we wondered what impact a March Easter had on Q1 GDP readings. In today’s Chart of the Day, we looked at how Q1 GDP has come in on an actual basis and relative to expectations based on whether Easter falls in March or April.
You can access today’s Chart of the Day by starting a 14-day no-obligation free trial to our paid research platform.
Apr 27, 2016
Apple (AAPL) is currently trading down more than 27% from its 52-week high of $134.54 made nearly a year ago. Ever since AAPL has fallen on hard times, and even before that, the stock’s relatively low earnings multiple has been cited as a key reason to own the stock. In today’s Chart of the Day, we have no interest in citing AAPL’s multiple as a bullish (or bearish) factor impacting the stock. What we do want to do, though, is show where AAPL’s multiple currently stands relative to other stocks in the S&P 500. We’ll let you make up your own mind as to whether you think its ranking is reason enough to own the stock or not.
You can access today’s Chart of the Day by starting a 14-day no-obligation free trial to our paid research platform.
Apr 26, 2016
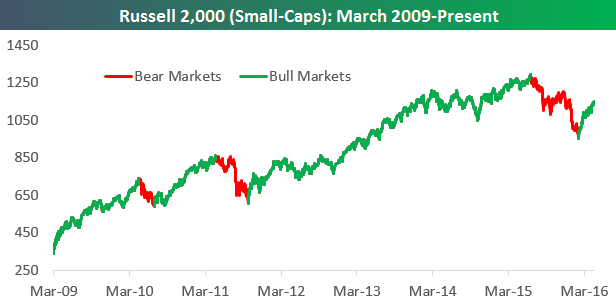
After falling 26% from its high last June through February 11th, the Russell 2,000 index of smallcap stocks is now up 20.5%. That 20.5% gain means the index has entered a new bull market.
In today’s Chart of the Day sent to our paid research members, we look at historical bull and bear markets for the Russell 2,000 to show how they typically run their course.
You can access today’s Chart of the Day by starting a 14-day no-obligation free trial to our paid research platform.
Apr 25, 2016
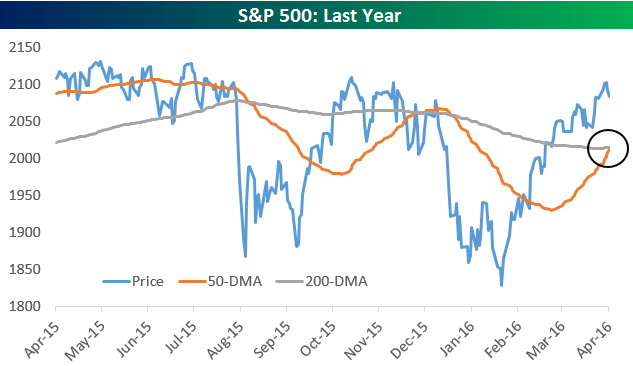
While the S&P 500 is starting off the week on a down note this morning, it’s also experiencing a “golden cross” today. Remember, a “golden cross” is when the 50-day moving average crosses above the 200-day moving average as both moving averages are rising.
While the “golden cross” is meant to be interpreted as a bullish technical formation, the back-tested performance numbers for many stocks and indices in the weeks and months following a “golden cross” aren’t anything special. But how about for the S&P 500? There have only been 16 prior “golden crosses” for the S&P in the index’s history, so they’re very rare. The most recent came on October 22nd, 2010.
In today’s Chart of the Day sent to our paid research members, we look at the S&P 500’s performance in the week, month, three months, and six months following the 16 prior “golden crosses” in its history.
You can access today’s Chart of the Day by starting a 14-day no-obligation free trial to our paid research platform.
Apr 22, 2016
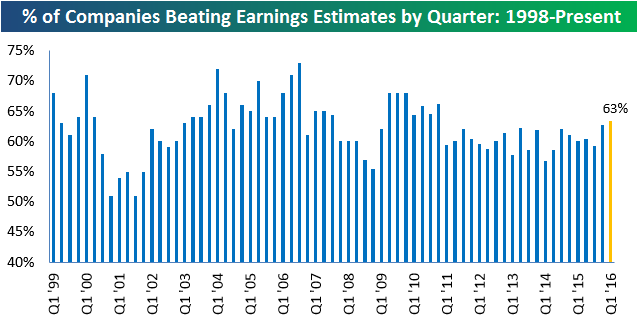
So far this earnings season, 309 companies have reported their Q1 numbers. While that’s just 20% or so of the total amount that will report this season, it’s enough to get an early read on how the numbers are coming in. Of the 309 companies that have reported thus far, 63% have beaten consensus analyst earnings estimates. Below is a chart showing the historical quarterly earnings beat rate going back to 1999. As you can see, a 63% beat rate for this season would be slightly stronger than last season’s beat rate, which itself was the strongest reading post since 2010. In today’s Bespoke Chart of the Day, we take a look at a few more early earnings season reads that are of interest to investors. Access to today’s Chart of the Day is included with each of our membership levels shown below. Click here if you would like to take a quick look at what you get with each membership level.
Newsletter Annual – $316/yr (20% off)
Newsletter Monthly – $39/mo (20% off)
Premium Annual – $795/yr (20% off)
Premium Monthly – $79/mo (20% off)
Institutional Annual – $1595/yr (20% off)
Institutional Monthly – $155/mo (20% off)
Apr 21, 2016
Like a lot of other stocks that reported since the closing bell, shares of Alphabet (GOOGL) are down sharply after hours. For GOOGL, a negative reaction to earnings is relatively uncommon for the stock, so in today’s Chart of the Day we took a look at how the stock has historically performed from the open to close following a negative gap in reaction to earnings. Access to today’s Chart of the Day, is included with each of our membership levels below. Click here for a quick look at what you get with each membership level.
Newsletter Annual – $316/yr (20% off)
Newsletter Monthly – $39/mo (20% off)
Premium Annual – $795/yr (20% off)
Premium Monthly – $79/mo (20% off)
Institutional Annual – $1595/yr (20% off)
Institutional Monthly – $155/mo (20% off)