Chart of the Day: Are Companies Finally Getting Optimistic?
This content is for members onlyChart of the Day: Earnings Revisions Spread Turns Positive
In our regular update of the various indicators we track, one notable standout today was the spread between positive and negative analyst earnings revisions for S&P 1500 stocks. In this morning’s update, we calculated that over the last four weeks, analysts had raised EPS forecasts for 612 companies in the S&P 1500 and lowered EPS forecasts for 605. This works out to a net of +7. That may not sound like much, but it’s actually the first positive earnings revisions reading we’ve seen in close to two years!
In today’s Chart of the Day, we highlight prior periods where the revisions spread turned positive after extended periods of a negative spread including how the overall equity market performed going forward.
Continue reading today’s Chart of the Day by starting a 14-day no-obligation free trial to our paid research platform.
Chart of the Day: April Auto Sales Tracking A Rebound
Analysts are expecting a big rebound of about 1mm (seasonally adjusted annual rate) in auto sales this month. Below we chart our tracking of the sales rate for the month of March as it evolved throughout the day last month.
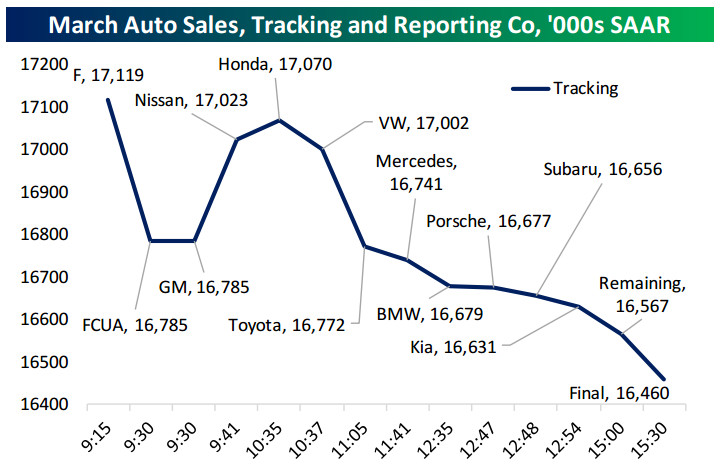
In today’s chart, we update that chart to reflect April sales figures. We also show sales volumes and growth by manufacturer for companies that have reported so far.
Continue reading today’s Chart of the Day on Apple (AAPL) by starting a 14-day no-obligation free trial to our paid research platform.
Chart of the Day: Apple 8-Day Losing Streak; Longest Since 1998
It’s been a rough couple of weeks for Apple (AAPL) and its shareholders. As shown in our trading range chart of the stock below, AAPL is now trading in extreme oversold territory at more than two standard deviations below its 50-day moving average (bottom of green shading). As recently as three weeks ago, the stock was trying to break above it’s 10-month downtrend channel and was actually at extreme overbought levels. That shows just how quickly sentiment has soured for the largest company in the world.

Things have gotten so bad recently that the stock can’t even manage one up day. If the stock closes lower today, it will mark its 8th consecutive down day. That hasn’t happened since 1998!
Continue reading today’s Chart of the Day on Apple (AAPL) by starting a 14-day no-obligation free trial to our paid research platform.
Chart of the Day – 4/29/16: Four Months Down…
After today, 2016 will already be one-third completed, and boy what a four months it has been. In today’s Chart of the Day, we wanted to summarize the historical performance of the S&P 500 in the month of May, from May through October, and from May through year end based on how the index performed in the first third of the year (through 4/30).
You can access today’s Chart of the Day by starting a 14-day no-obligation free trial to our paid research platform.