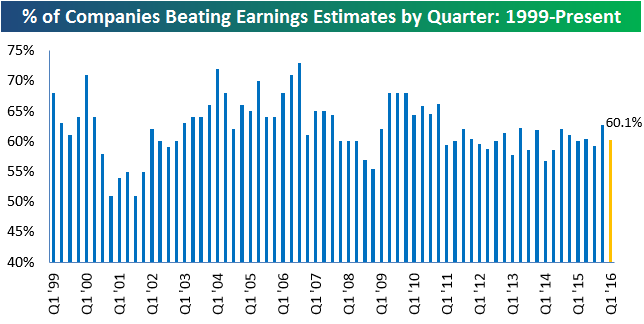
Chart of the Day: Earnings Season Winds Down
Below is a look at the earnings beat rate so far this earnings season (highlighted in orange) compared to past quarters going back to 1999. As shown, 60.1% of the 2,400+ companies that have reported this quarter have beaten consensus analyst estimates. That’s well below last quarter’s reading but slightly above the reading from two quarters ago. Since 1999, the average beat rate for any given quarter has been 61.9%, so this season is tracking just below average.
In today’s Chart of the Day sent to paid subscribers, we highlight a few additional earnings statistics that shed light on sector beat and miss rates as well as how stocks are reacting to earnings this season. To view the report, please start a 14-day free trial below.
Chart of the Day: AAPL = IEI
This content is for members onlyChart of the Day: Markets Leaning Democratic?
This content is for members onlyChart of the Day: Dividend Cuts Hit a Seven-Year High
When it comes to corporate actions in times of financial duress, one of the hardest decisions for a company to make is cutting its dividend. In companies known for paying dividends, the dividend is considered sacrosanct, so the last thing the company wants to do is lose credibility with investors by cutting it. In spite of that, when times are tough companies often have no other choice, and as the last couple of years have shown, it has become increasingly common for companies to cut their payouts.
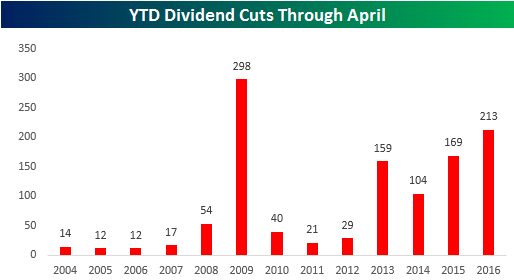 Based on data from the Standard and Poors monthly dividend report, through the first four months of the year, 213 US companies have announced dividend cuts (upper chart right), which is the most cuts through April since the depths of the Financial Crisis in 2009, when 298 companies cut their payouts.
In today’s Chart of the Day, we highlight prior periods where the revisions spread turned positive after extended periods of a negative spread including how the overall equity market performed going forward.
Continue reading today’s Chart of the Day by starting a 14-day no-obligation free trial to our paid research platform.