Chart of the Day: Anything But Defensive
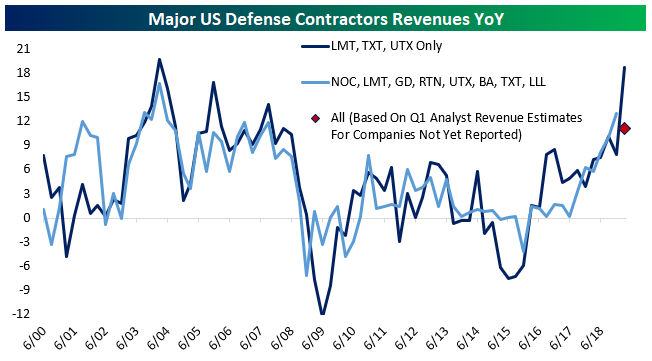
This morning, Lockheed-Martin (LMT) smashed earnings expectations, reporting $5.99 EPS for Q1 versus $4.34 expected. The beat was driven by sales of $14.3bn, exceeding analyst estimates of $12.6bn, and also came with a dramatic upgrade to guidance for all financial metrics this fiscal year. The triple play from LMT joined strong reports from Textron (TXT) and United Technologies (UTX). Together, these three companies are seeing combined revenues grow at a staggering 18.7% YoY, the fastest since defense spending’s huge ramp up following the 9/11 attacks and the invasions of Afghanistan and Iraq. Among other defense contractors, analysts are projecting revenue numbers for Q1 that would indicate a significantly lower revenue growth number, but if the results from LMT, TXT, and UTX are any indication, those forecasts are going to be handily beaten.
So which of the other defense contractors currently look the most attractive?
Continue reading this Chart of the Day by starting a two-week free trial to any of our research membership levels.