Chart of the Day: April and YTD Decile Analysis
This content is for members onlyChart of the Day: Alphabet (GOOG) Set For Biggest Gap Down on Earnings Ever
This content is for members onlyChart of the Day: May Seasonality + Sell in May
One of the best months of the year from a seasonal perspective (April) is quickly coming to an end, and now investors are set to enter a period of the year that usually produces sub-par returns relative to other periods. There is also a significant difference in performance during the month of May based on whether the stock market is up or down year-to-date through April.
And what about the old saying “Sell in May and Go Away”? Is there any truth to it? Each year the “Sell in May” theory gets trotted out, but we have the data to prove whether investors really should hit the “Sell” button and then wait for six months until November rolls around.
Continue reading this Chart of the Day by starting a two-week free trial to any of our research membership levels.
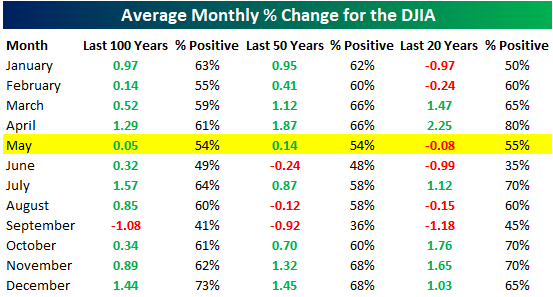
Chart of the Day: Dollar Rip Isn’t Hurting Internationals Yet
This content is for members onlyChart of the Day: How Are Market Internals Doing?
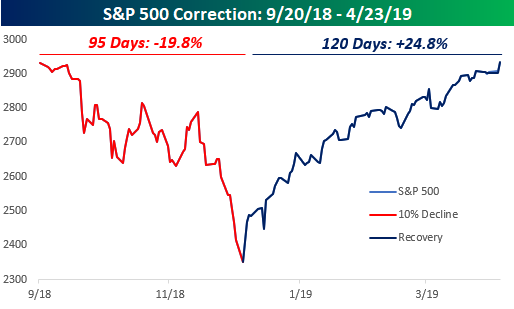
The S&P 500’s record all-time closing high on Tuesday culminated a seven-month period of two massive swings in the US stock market. Bulls most certainly welcomed the new closing high, confirming the continuation of the bull market. But when it comes to some of our favorite internal market indicators, how does their recent performance stack up?
Continue reading this Chart of the Day by starting a two-week free trial to any of our research membership levels.