Aug 20, 2020
Amazon (AMZN) is up to 5.7% of the S&P 500’s market cap. While other large tech-adjacent names have had a similarly large impact on the aggregate market this year, the e-commerce giant remains somewhat unique for its scale and penetration into every possible market. At the same time, it’s interesting to note that many other retailers have been able to thrive in this environment. Target (TGT), Wal-Mart (WMT), Home Depot (HD), and Lowe’s (LOW) are all examples of retailers that have leveraged a combination of unique offerings and extremely rapid digital sales growth. 100% YoY sales growth for digital channels is the norm for many major retailers at this point. Unfortunately, while some companies have been able to thrive in the current environment, smaller and more specialized retailers haven’t been able to drive traffic as well. Two recent de-listings removed from our index this month (ASNAQ and TLRDQ) are examples of stocks that haven’t been able to keep up.
Our “Death By Amazon” index was created many years ago to provide investors with a list of retailers we view as vulnerable to competition from e-commerce. In 2016, we also created our “Amazon Survivors” index which is made up of companies that look more capable of dealing with the threat from online shopping. To see how the two indices have been performing lately and view the full list of stocks that make up the indices, please read our newest report on the subject available to Bespoke Premium and Bespoke Institutional members.
To unlock our “Death By Amazon” and “Amazon Survivors” indices, login or start a two-week free trial to either Bespoke Premium or Bespoke Institutional.

Aug 19, 2020
Walmart (WMT) wrapped up the Q2 2020 earnings reporting period on Tuesday with a huge beat on both the top and bottom line. It was a fitting end to what turned out to be a record-setting earnings season.
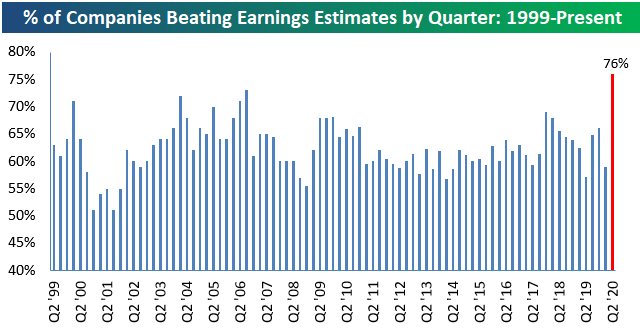
As we highlighted in our Q2 Earnings Season preview in early July, analysts were rapidly increasing earnings estimates leading up to earnings season. Normally when that happens, stocks have trouble performing well during earnings season because the expectations bar has been set higher. This season, even with analyst estimates on the rise in the four weeks leading up to the start of the reporting period, companies managed to beat bottom-line EPS estimates at the highest rate in the history of our database going back to 1999.
As shown below, 76% of companies reported stronger-than-expected EPS numbers this season, which eclipsed the prior record high of 73% seen during the Q3 2006 reporting period.
Long-term Bespoke subscribers know how much we like earnings triple plays, but for those that haven’t heard of the term, we came up with it back in the mid-2000s. An earnings triple play is a company that beats EPS estimates, beats revenue estimates, and raises forward guidance all in the same quarterly earnings report. Investopedia.com is one of the best online resources for financial markets education, and they’ve actually given us credit for coining the “triple play” term on their website. We consider triple play stocks to be the cream of the crop of earnings season, and we are constantly finding new long-term buy opportunities from this basket of names each quarter.
This earnings season there were a massive number of earnings triple plays. We went through the list of this season’s triple plays to find the ones that have the most attractive set-ups heading into the earnings off-season. Today we have identified 37 stocks that made the cut. To see these names, simply start a two-week free trial to Bespoke Premium today. Upon sign-up, you’ll unlock our Top Triple Plays report!
Aug 14, 2020
At the headline level, July’s Retail Sales report disappointed as the reading missed expectations by nearly a full percentage point. Just as soon as the report was released, we saw a number of stories pounce on the disappointment as a sign that the economy was losing steam. Looked at in more detail, though, the July report wasn’t all that bad. While the headline reading rose less than expected (1.2% vs 2.1%), Ex Autos and Ex Autos and Gas, the results were much better than expected. Not only that, but June’s original readings were all revised higher by around a full percentage point.
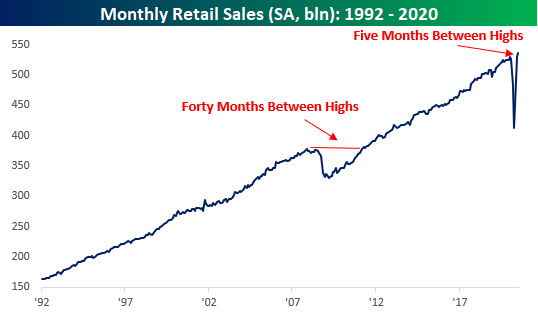
Besides the fact that this month’s report was better underneath the surface and June’s reading was revised higher, it was also notable as the seasonally-adjusted annualized rate of sales in July hit a new record high. After the last record high back in January, only five months passed until American consumers were back to their pre-Covid spending ways. For the sake of comparison, back during the Financial Crisis, 40 months passed between the original high in Retail Sales in November 2007 and the next record high in April 2011. 5 months versus 40? Never underestimate the power of the US consumer!
While the monthly pace of retail sales is back at all-time highs, the characteristics behind the total level of sales have changed markedly in the post COVID world. In our just released B.I.G. Tips report we looked at these changing dynamics to highlight the groups that have been the biggest winners and losers from the shifts. For anyone with more than a passing interest in how the COVID outbreak is impacting the economy, our monthly update on retail sales is a must-read. To see the report, sign up for a monthly Bespoke Premium membership now!
Aug 11, 2020
Whether you want to look at it from the perspective of closing prices or intraday levels, the S&P 500 is doing what just about everybody thought would be impossible less than five months ago – approaching record highs. Relative to its closing high of 3,386.15, the S&P 500 is just 0.27% lower, while it’s within half of a percent from its record intraday high of 3,393.52. Through today, the S&P 500 has gone 120 trading days without a record high, and as shown in the chart below, the current streak is barely even visible when viewed in the perspective of all streaks since 1928. Even if we zoom in on just the last five years, the current streak of 120 trading days only ranks as the fourth-longest streak without a new high.
While the S&P 500’s 120-trading day streak without a new high isn’t extreme by historical standards, the turnaround off the lows has been extraordinary. In the S&P 500’s history, there have been ten prior declines of at least 20% from a record closing high. Of those ten prior periods, the shortest gap between the original record high and the next one was 309 trading days, and the shortest gap between highs that had a pullback of at least 30% was 484 tradings days (or more than four times the current gap of 120 trading days). For all ten streaks without a record high, the median drought was 680 trading days.

Whenever the S&P 500 does take out its 2/19 high, the question is whether the new high represents a breakout where the S&P 500 keeps rallying into evergreen territory, or does it run out of gas after finally reaching a new milestone? To shed some light on this question, we looked at the S&P 500’s performance following each prior streak of similar duration without a new high. To read the report, start a two-week free trial to Bespoke Premium today.