B.I.G. Tips – Bearishly Bullish
This content is for members onlyEarly Cycle Pattern For Philly Fed
 One typical characteristic about a rally early on in a market or economic cycle is that breadth is extremely positive. Following a deep and prolonged downturn in the market or the economy, things get so beat down that any improvement tends to lift all or most boats early on. Then, the deeper you get into the cycle, the thinner breadth becomes as certain sectors start to fade. In this regard, when the market or economy peaks, breadth usually shows signs of narrowing before the actual high.
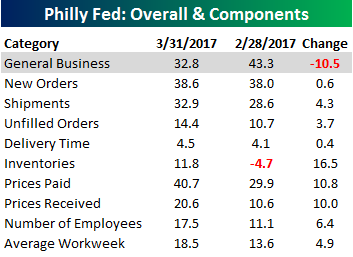
That’s what makes yesterday’s release of the Philly Fed Manufacturing report for March so interesting. While the headline index showing General Business Conditions declined m/m following February’s surge to the 30+ year high, all nine of the report’s sub-indices showed m/m gains. That’s a rare trend. To illustrate, going back to 1980, there have only been three other monthly reports where the index of General Business Conditions declined m/m, but every other sub-index increased. Those occurrences were in May and September of 1996 and December 2003.
In a B.I.G. Tips report sent out to subscribers earlier, we summarized the results of an analysis we did of prior periods where, like the current period, breadth in the Philly Fed report has been strong for multiple months in a row. Even more interesting than where these prior periods occurred during the economic cycle was how the equity market performed in the months after these prior periods of broad strength. To see the results of this insightful analysis, sign up for a monthly Bespoke Premium membership now!
Years Like 2017: March Edition
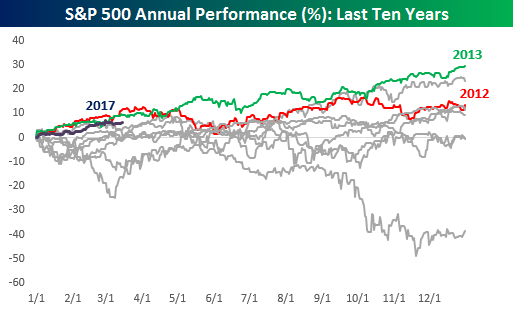 It’s hard to believe that we’re already fifty trading days into the year, meaning that 2017 is already just about 20% in the books. The best way to characterize 2017? We’d say “so far, so good.” With a gain of 6.5%, 2017 ranks as the third best start to a year in the last ten years, behind both 2012 and 2013, and in both of those years, the index finished the year higher than it was on 3/15. Today, we wanted to take this one step further and look at past years that started off looking the most similar to 2017.
To that end, as we do throughout the year, we analyzed years where the S&P 500’s closing prices had the greatest correlation to the closing prices so far in 2017. Then, for each year, we provided a summary including the correlation coefficient between closing prices for that year to the S&P 500 YTD through 3/15, how the S&P 500 performed YTD in each year through 3/15, and then how the index performed over the remainder of the year, including maximum gains and losses from the 3/15 closing level.
While history doesn’t always repeat itself exactly, patterns in the market have a way of repeating themselves, which makes this analysis extremely interesting as well as useful. To see the report, sign up for a monthly Bespoke Premium membership now!
B.I.G. Tips – Death by Amazon – 3/16/17
This content is for members onlyRetail Sales Rest
After a blowout retail sales report for January, this morning’s release for February showed a much more subdued, although still positive, pace of retail sales. On a headline basis, Retail Sales rose 0.1% m/m which was right inline with expectations. Ex Autos and Ex Autos and Gas, today’s report was also right inline with expectations with growth of 0.1% and 0.2%, respectively. Getting back to January’s report, in addition to being considerably better than expected in the initial release, revisions pushed the growth levels even higher, with headline being revised up to 0.6% from 0.4%, and Ex Autos and Ex Autos and Gas both being revised up above 1%.
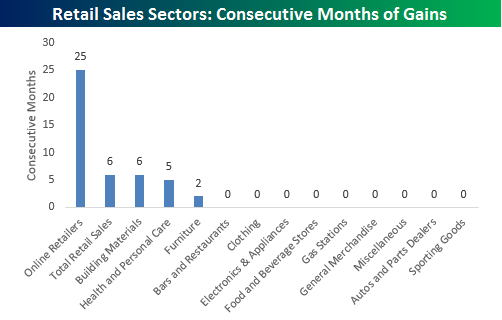
While headline retail sales were uneventful, underneath the service there were some major moves. One of those moves concerns online sales, which have just been sucking up share like a vacuum. As just one example, take a look at the chart below which shows how long each of the thirteen sectors in the Retail Sales report has seen m/m increases. At 25 months and counting, the current streak for online is more than four times as long as the next closest sector Building Materials. Never before in the history of the Retail Sales report (going back to 1993) has any sector seen a similar streak of m/m gains in sales.
For more detailed analysis and coverage of the February retail sales report, sign up for a monthly Bespoke Premium membership now!