B.I.G. Tips – Trading Like It’s 1995
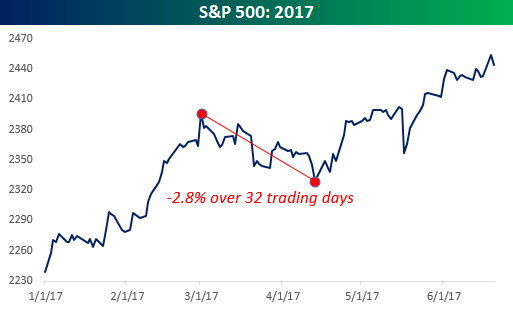
With the first half of 2017 nearly complete, investors really have gotten off easy in 2017. Inundated with headlines about scandals involving officials at all levels in Washington, stocks have seemingly done nothing but go up as the S&P 500 has 24 all-time closing highs since the year started. The worst sell-off the S&P 500 has seen from a closing basis this year was a 2.8% decline over 32 trading days from March 1st through April 13th. Maybe we’re getting old, but we can remember the days back in 2007 and 2008 when 2.8% declines were common in a single day. At one point over a 50-trading day period in 2008, the S&P 500 averaged an absolute daily change of 4.00%!
2017 has been so easy on the bulls, in fact, that there has only been one other year in the S&P 500’s history where it saw a smaller maximum drawdown in the first half fo the year. In a B.I.G. Tips report sent to our clients earlier today, we looked at prior years where the S&P 500 steadily rose in the first half of the year with little in the way of drawdowns along the way to see how equities performed in the second half. You’d be surprised at the results. For anyone interested in seeing this report, sign up for a monthly Bespoke Premium membership now!
B.I.G. Tips – CAT Sales Start to Purr
This content is for members onlyB.I.G. Tips – Nasdaq 100 on the Cusp
The Nasdaq 100 came close to breaking below its 50-day moving average this morning, but in afternoon trading things have bounced back a bit. In the charts below, you’ll see that the Nasdaq 100 has been above its 50-day moving average for all of 2017 so far; the last time the index closed below its 50-day was on December 6th, 2016 — 131 trading days ago. If the index manages to close above its 50-day once again today, the current 131-trading day streak will be the third longest in the index’s history. As shown in the second chart below, there have only been 7 prior streaks of 100 trading days or more.
In a B.I.G. Tips report just sent to paid research clients, we analyze how the Nasdaq 100 typically performs in the days and weeks after a streak like the current one comes to an end. To find out whether a 50-DMA break is a bearish signal or not, start a 14-day free trial to our Bespoke Premium package now. You’ll receive a 20% off lifetime discount along with the 14-day free trial if you use this checkout link. Here’s a breakdown of the products you’ll receive.


B.I.G. Tips – Retail Sales Miss Estimates For Second Straight Month
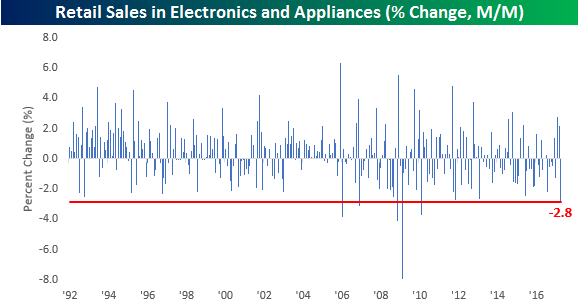
Retail Sales for the month of May were released earlier today and missed expectations for the second straight month. Prior to the last two weaker than expected reports, the two reports before that were right inline with forecasts. Therefore, it has now been over four months since we last saw a stronger than expected retail sales report. In a B.I.G. Tips report just published, we provided our monthly update to the Retail Sales reports, which includes key trends surrounding each month’s release. Just one of the many trends that stuck out this month was that sales in the Electronics and Appliances sector dropped 2.85%. As shown in the chart below, that is the largest monthly decline since March 2010 and the sixth largest m/m decline since data begins in 1992! For anyone interested in seeing this report, sign up for a monthly Bespoke Premium membership now!
B.I.G. Tips – Fed Days June 2017
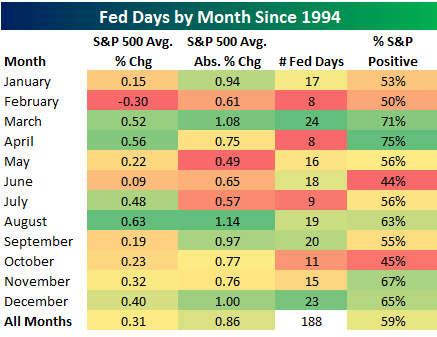
Tomorrow is yet another Fed Day — the third of 2017. Prior to each Fed Day, Bespoke publishes an in-depth analysis of the market’s historical performance on these extremely impactful trading days. You’d be surprised to see just how much of the market’s returns over the years have come from Fed Days, which represent just 3% of all trading days.
As a taste, below is one of many tables and charts included in our Fed Days report. It highlights the S&P 500’s performance on Fed Days by month of the year going back to 1994 when the Fed began announcing policy decisions on the day of its meetings. Unfortunately for market bulls, the S&P 500 has been up on June Fed Days less than any other month of the year. Keep that in mind heading into the trading day tomorrow.
To see our full “Fed Days” analysis, start a 14-day free trial to our Bespoke Premium package now. You’ll receive a 20% off lifetime discount along with the 14-day free trial if you use this checkout link. Here’s a breakdown of the products you’ll receive.