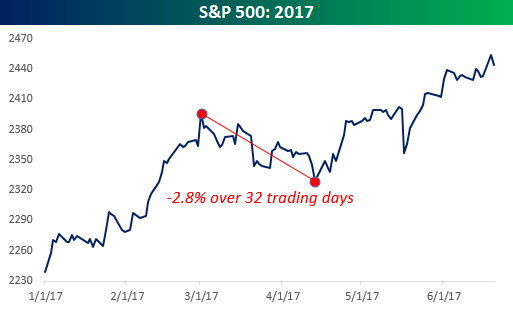
With the first half of 2017 nearly complete, investors really have gotten off easy in 2017. Inundated with headlines about scandals involving officials at all levels in Washington, stocks have seemingly done nothing but go up as the S&P 500 has 24 all-time closing highs since the year started. The worst sell-off the S&P 500 has seen from a closing basis this year was a 2.8% decline over 32 trading days from March 1st through April 13th. Maybe we’re getting old, but we can remember the days back in 2007 and 2008 when 2.8% declines were common in a single day. At one point over a 50-trading day period in 2008, the S&P 500 averaged an absolute daily change of 4.00%!
2017 has been so easy on the bulls, in fact, that there has only been one other year in the S&P 500’s history where it saw a smaller maximum drawdown in the first half fo the year. In a B.I.G. Tips report sent to our clients earlier today, we looked at prior years where the S&P 500 steadily rose in the first half of the year with little in the way of drawdowns along the way to see how equities performed in the second half. You’d be surprised at the results. For anyone interested in seeing this report, sign up for a monthly Bespoke Premium membership now!