Jul 21, 2017
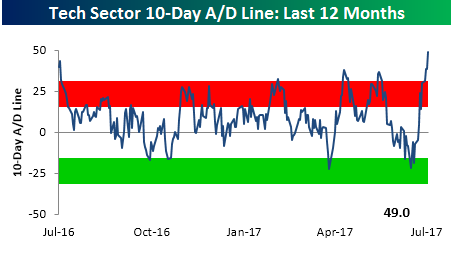
The chart below appears in each week’s Sector Snapshots report and shows the 10-day advance decline line for the S&P 500 Technology sector over the last year. Throughout the month of June, we saw a steady decline in this reading as it drifted from extreme overbought to oversold levels. Since the beginning of July, however, the fireworks started to fly and breadth has come roaring back to levels not seen in at least a year.
Taking a longer term look at the Technology sector’s 10-day A/D line, would you believe that the reading through yesterday’s close was the fifth best single day reading on record? Also, the only other times we have ever seen a higher reading were also during the month of July. What is it about July and the Tech sector? In a B.I.G Tips report we just sent out to clients, we looked at prior extreme breadth readings for the Technology sector to see how it performed going forward. For anyone trying to decide whether to take profits or add exposure to the sector, the results are a must see!
If you are interested in obtaining this report, sign up for a monthly Bespoke Premium membership now!
Jul 6, 2017
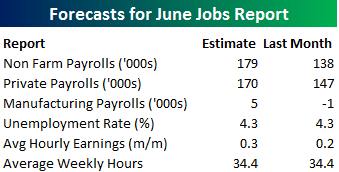
Heading into Friday’s Non Farm Payrolls (NFP) report for June, economists are expecting an increase in payrolls of 179K, which would be a 41K gain from last month’s much weaker than expected reading of 138K. In the private sector, economists are also expecting an increase of 170K, which would represent a modestly smaller gain than the headline number. The unemployment rate is forecasted to remain unchanged at 4.3%. Growth in average hourly earnings is expected to accelerate to 0.3%, while average weekly hours worked is also forecast to remain unchanged at 34.4.
Ahead of the report, we just published our eleven-page monthly preview for the April jobs report. This report contains a ton of analysis related to how the equity market has historically reacted to the monthly jobs report, as well as how secondary employment-related indicators we track looked in September. We also include a breakdown of how the initial reading for September typically comes in relative to expectations and how that ranks versus other months.
One topic we cover in each month’s report is the S&P 500 stocks that do best and worst from the open to close on the day of the employment report based on whether or not the report comes in stronger or weaker than expected. In other words, which stocks should you buy, and which should you avoid? The table below highlights the best-performing stocks in the S&P 500 from the open to close on days when the Non-Farm Payrolls report has been better than expected over the last two years. Of the 25 top performing stocks, seven sectors are represented, and Technology leads the way with seven. One of the top performing and consistently positive stocks on these days is Qorvo (QRVO) which as seen an average gain of 2.28% with positive returns 90% of the time.
For anyone with more than a passing interest in how equities are impacted by economic data, this report is a must read. To see the report, sign up for a monthly Bespoke Premium membership now!
Jul 5, 2017
In what has become an increasingly disheartening trend for investors and traders loaded up to the gills on tech stocks, while the DJIA traded up 0.60% on Monday, the Nasdaq lost ground all day and finished lower by nearly half a percent. Had the session not ended at 1 PM, the damage in Nasdaq could have been even worse. Monday’s underperformance was the third time in under a month that the Nasdaq underperformed what had been the out of favor Dow Jones Industrials by more than 1% in a given day.
Naturally, the Nasdaq’s recent underperformance has investors questioning whether the rotation represents a broader shift in investor sentiment out of the high multiple growth stocks and into more cyclical industrials. To help frame this issue, in a just published B.I.G. Tips report, we looked to see how uncommon (or common) it is to see the Nasdaq have multiple days of large underperformance (1%+) relative to the Dow in a four week period. Further, we also analyzed market performance in the period following each of these occurrences. The current period represents the fifth time during this bull market that we have seen the Nasdaq underperform the DJIA by more than 1% over a four-week span (chart below). For anyone interested in seeing this report, sign up for a monthly Bespoke Premium membership now!
