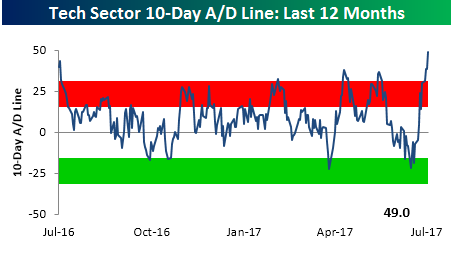
The chart below appears in each week’s Sector Snapshots report and shows the 10-day advance decline line for the S&P 500 Technology sector over the last year. Throughout the month of June, we saw a steady decline in this reading as it drifted from extreme overbought to oversold levels. Since the beginning of July, however, the fireworks started to fly and breadth has come roaring back to levels not seen in at least a year.
Taking a longer term look at the Technology sector’s 10-day A/D line, would you believe that the reading through yesterday’s close was the fifth best single day reading on record? Also, the only other times we have ever seen a higher reading were also during the month of July. What is it about July and the Tech sector? In a B.I.G Tips report we just sent out to clients, we looked at prior extreme breadth readings for the Technology sector to see how it performed going forward. For anyone trying to decide whether to take profits or add exposure to the sector, the results are a must see!
If you are interested in obtaining this report, sign up for a monthly Bespoke Premium membership now!