Apr 4, 2019
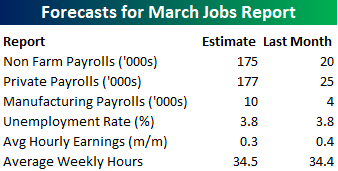
Heading into Friday’s Non Farm Payrolls (NFP) report for March, economists are expecting an increase in payrolls of 175K, which would be a major improvement from February’s paltry reading which came in at just 20K for the tenth biggest miss relative to expectations since at least 1999. In the private sector, economists are expecting an increase of 177K, which would imply a similar increase versus February as the headline reading. The unemployment rate is expected to remain unchanged at 3.8%. Average hourly earnings are expected to grow at a rate of 0.3% versus the 0.4% reading last month. Finally, average weekly hours are expected to be unchanged at 34.5.
One trend worth highlighting about recent NFP reports is that they have been extremely volatile relative to expectations. In each of the last three months, the originally reported number was off the mark by at least 100K for an average of 142K above or below expectations. Since 1999, there have only been three other periods where the original number was that far off expectations by at least 100K for three months in a row, and the last occurrence was in 2004.
Ahead of the report, we just published our eleven-page preview of the March jobs report. This report contains a ton of analysis related to how the equity market has historically reacted to the monthly jobs report, as well as how secondary employment-related indicators we track looked in March. We also include a breakdown of how the initial reading for March typically comes in relative to expectations and how that ranks versus other months.
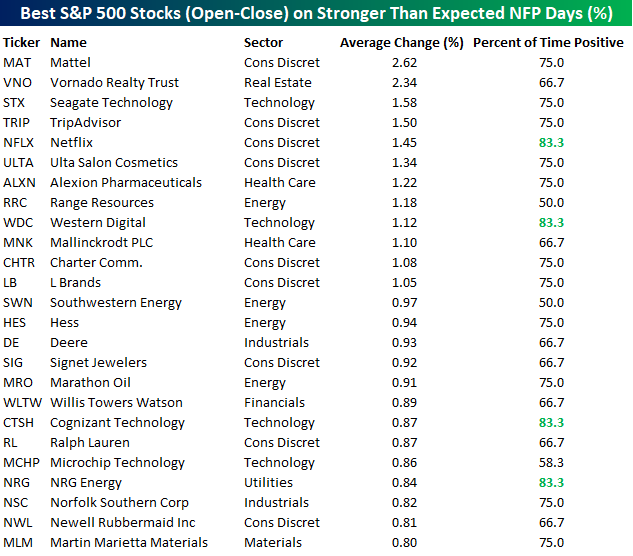
One topic we cover in each month’s report is the S&P 500 stocks that do best and worst from the open to close on the day of the employment report based on whether or not the report comes in stronger or weaker than expected. In other words, which stocks should you buy, and which should you avoid? The table below highlights the best-performing stocks in the S&P 500 from the open to close on days when the Non-Farm Payrolls report has been better than expected over the last two years.
Of the top performing stocks on days when NFP beats expectations, nine sectors are represented, but Consumer Discretionary leads the way with nine. Mattel (MAT) has been the best performing stock with an average open to close gain of 2.62%, but another eleven have seen average open to close gains of more than 1%. In terms of consistency, Netflix, Western Digital, Cognizant, and NRG have all been positive 83% of the time.
For anyone with more than a passing interest in how equities are impacted by economic data, this March employment report preview is a must-read. To see the report, sign up for a monthly Bespoke Premium membership now!
Apr 3, 2019
Log-in here if you’re a member with access to our B.I.G. Tips reports.
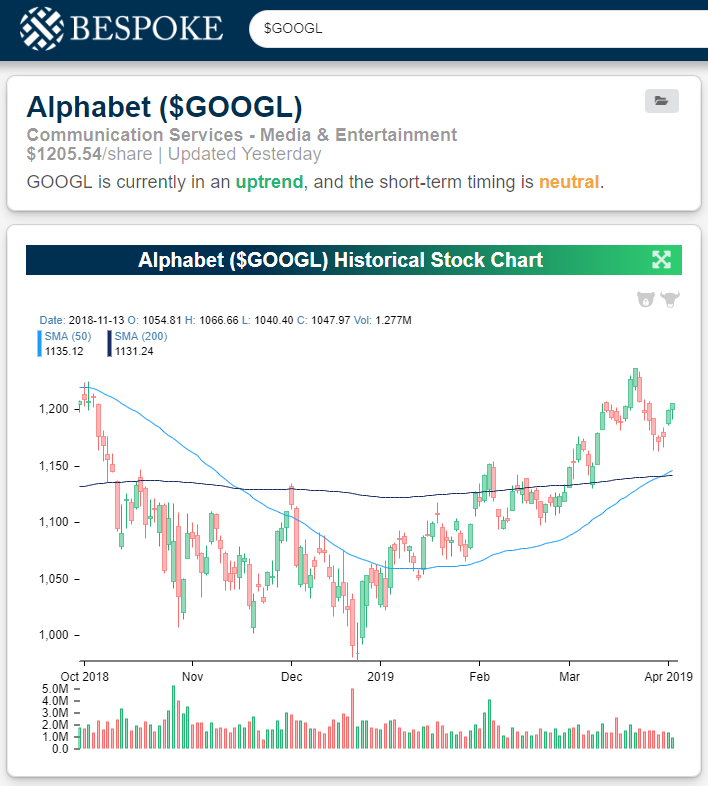
Twelve stocks in the Nasdaq 100 are currently rated as “uptrending” with “good” or “perfect” timing based on our proprietary “Trend” and “Timing” algorithms. These algos analyze the price action of every stock on a daily basis. It’s not a perfect algo just yet, but it is a great starting point for finding new opportunities or monitoring an existing portfolio. In our new Tools section, you can pull up trend and timing ratings with our Trend Analyzer, and you can also see the trend and timing scores for individual stocks or ETFs when you search for them in our Search bar. Here’s an example using Alphabet (GOOGL). If you’d like to build a custom portfolio of stocks and/or ETFs to monitor, simply head to our Custom Portfolios section and get started.
A stock will receive an “uptrend” rating if its price has made a series of higher highs and higher lows over the last six months. In terms of timing, anything that is trading overbought or extremely overbought will be considered “neutral” at best and “bad” in extreme scenarios. Before adding to or buying a new position, we’d prefer to wait for downside mean reversion to occur if the stock is trading at extremely overbought levels. A stock that is trending higher but trading inside of its “normal” trading range will have a “good” timing score — meaning it’s okay to enter the position. If a stock is uptrending but has moved to oversold territory, it becomes even more attractive from a timing perspective. In these instances, though, you’ll sometimes find that our algo doesn’t quite capture a stock that has just recently broken down, so that’s why it’s important to add in the ‘human touch’ and pull up a price chart for each individual name you’re interested in using the Search bar.
To continue reading and see which Nasdaq 100 stocks are currently in an uptrend with “good” timing scores, you’ll need to start a two-week free trial to Bespoke Premium. CLICK HERE to start your free trial now.

Mar 27, 2019
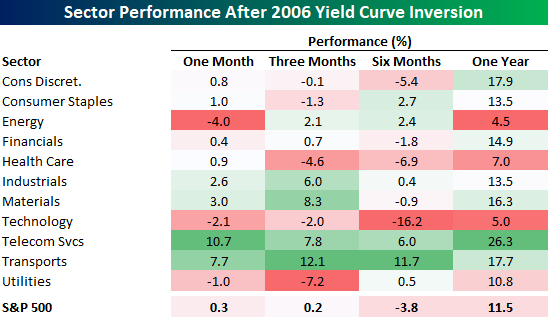
In our latest B.I.G Tips report, we detail and summarize sector performance following periods where the yield curve first inverts after two-years or more of not being inverted. One of the periods we looked at was the most recent period prior to last week, which was back in 2006. The 2006 inversion was followed by mixed market returns. One month later, the S&P 500 was essentially flat with Telecom Services and Transports leading the way higher as Energy and Utilities both declined. Three and six months later, the S&P 500 saw similarly mixed returns, but one year later, the S&P 500 was up over 11% and every sector was up at least 4.5%. The party ended shortly thereafter, however, as the Global Financial Crisis took hold in late 2007 through early 2009.
To gain access to the full report which contains more of the same analysis for each of the periods where we saw similar inversions after at least two years without an inversion, please start a two-week free trial to our Bespoke Premium package now. Here’s a breakdown of the products you’ll receive.