Apr 23, 2019
That was fast! When it comes to market recoveries from a correction, they don’t get much more v-shaped than the last seven months. After falling just short of a 20% decline (on a closing basis) in the span of 95 calendar days from 9/20/18 to 12/24/18, the S&P 500 has charged back and is on the cusp of closing above its record closing high from 9/20. If it closes above that level today, it will have rallied 24.7% in the span of just 120 days.
Present company included, there aren’t that many people who back in December would have anticipated a record closing high in the S&P 500 before April 30th! In our just-released B.I.G. Tips report, we took a look at prior corrections from all-time highs in the post-WWII period based on their magnitude and duration as well as how long it took them to reclaim their prior highs. We then compared those periods to the current one to find which ones had the most in common.
To gain access to the full report, please start a two-week free trial to our Bespoke Premium package now. Here’s a breakdown of the products you’ll receive.

Apr 23, 2019
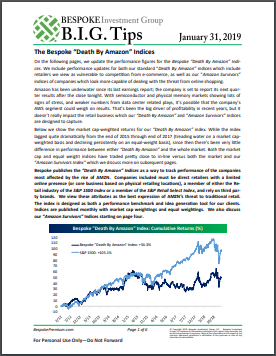
Our “Death By Amazon” index was created many years ago to provide investors with a list of retailers we view as vulnerable to competition from e-commerce. In 2016, we also created our “Amazon Survivors” index which is made up of companies that look more capable of dealing with the threat from online shopping. To see how the two indices have been performing lately and view the full list of stocks that make up the indices, please read our newest report on the subject available to Bespoke Premium and Bespoke Institutional members.
To unlock our “Death By Amazon” and “Amazon Survivors” indices, login or start a two-week free trial to either Bespoke Premium or Bespoke Institutional.

Apr 10, 2019
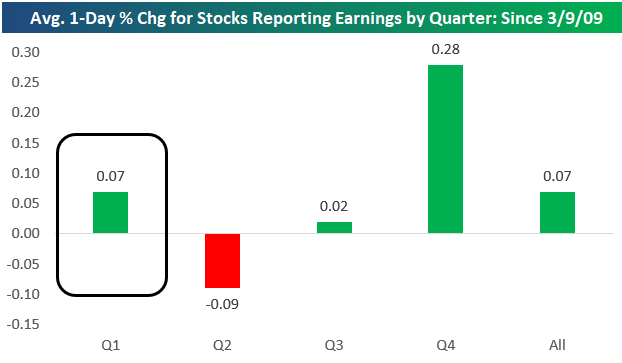
Below is a chart showing the average performance of stocks on their earnings reaction days by earnings season since the start of the bull market back on March 9th, 2009. By far the best period of the year for stocks to report earnings has been the Q4 reporting period, which runs from early January through late February. During this reporting period, stocks have averaged a one-day gain of 0.28% on their earnings reaction days over the last 10 years.
The second best period has been the Q1 reporting period (which is upcoming and runs from early April through late May). During the Q1 earnings season, the average stock has gained 0.07% on its earnings reaction day. (Remember, for stocks that report before the open, their earnings reaction day is that trading day. For stocks that report after the close, their earnings reaction day is the following trading day.)
The Q3 reporting period (early October through late November) sees stocks trade basically flat, while the Q2 earnings season (early July through late August) has actually seen stocks average a decline of 0.09% on their earnings reaction days since the bull market began.
One of the ways we use our Earnings Explorer tool as an idea generator is to look for stocks that typically perform very positively or negatively in certain quarters of the year. With the Q1 reporting period starting up this week, now is a good time to highlight the stocks that have historically performed the best following their Q1 reports. Below is a list of stocks with market caps above $5 billion that have historically performed the best in reaction to their Q1 earnings reports. To make the list, the stock had to have at least 8 years of Q1 reports, so these stocks have been consistently positive during Q1 for a long time.
Please log-in or start a free membership trial to continue reading this report…
Apr 9, 2019
Earnings season kicks off this week as some of the major banks are set to report Q1 earnings. JP Morgan (JPM), PNC, and Wells Fargo (WFC) will all report Friday morning, and then Citi (C) and Goldman (GS) will report Monday morning. Outside of the big banks, the only other reports of note this week are Delta (DAL) on Wednesday morning, Bed Bath & Beyond (BBBY) on Wednesday afternoon, and Rite Aid (RAD) Thursday morning. Things don’t really start to pick up, though, until next week, and the peak reporting day will be on 4/25 when 64 companies in the S&P 500 are set to report.
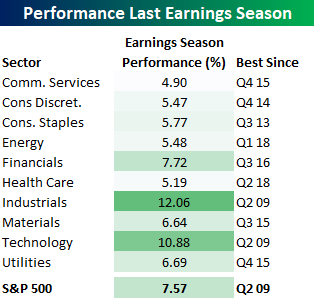
Given the equity market’s strong performance during the last earnings season, it’s going to be hard to get a repeat performance. That doesn’t mean returns can’t be positive, but if you are expecting anything resembling the last earnings season, you’re being way too greedy. The table below shows the performance of the S&P 500 and each sector during the Q4 earnings season (1/11—2/22) and how that performance ranked versus prior quarters. With a gain of 7.57%, the S&P 500’s performance was the best earnings season showing since the Q2 2009 reporting period. Industrials and Technology were the same with a gain of 10.9%. Other sectors with notable performance relative to recent history included Consumer Staples (best since Q3 2013) and Consumer Discretionary (best since Q4 2014).
To gain access to the full report which provides a detailed look at how the S&P 500 and individual sectors have performed during prior earnings season based analyst sentiment heading into the period, please start a two-week free trial to our Bespoke Premium package now. Here’s a breakdown of the products you’ll receive.