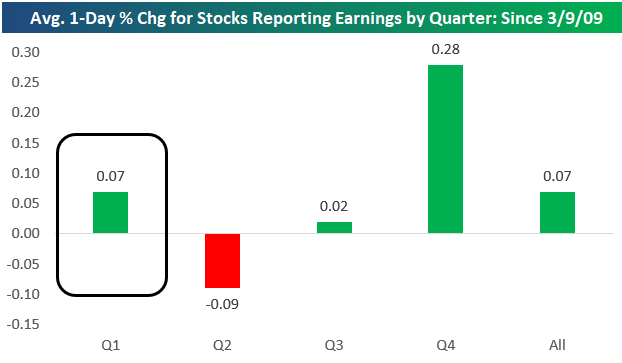
Below is a chart showing the average performance of stocks on their earnings reaction days by earnings season since the start of the bull market back on March 9th, 2009. By far the best period of the year for stocks to report earnings has been the Q4 reporting period, which runs from early January through late February. During this reporting period, stocks have averaged a one-day gain of 0.28% on their earnings reaction days over the last 10 years.
The second best period has been the Q1 reporting period (which is upcoming and runs from early April through late May). During the Q1 earnings season, the average stock has gained 0.07% on its earnings reaction day. (Remember, for stocks that report before the open, their earnings reaction day is that trading day. For stocks that report after the close, their earnings reaction day is the following trading day.)
The Q3 reporting period (early October through late November) sees stocks trade basically flat, while the Q2 earnings season (early July through late August) has actually seen stocks average a decline of 0.09% on their earnings reaction days since the bull market began.
One of the ways we use our Earnings Explorer tool as an idea generator is to look for stocks that typically perform very positively or negatively in certain quarters of the year. With the Q1 reporting period starting up this week, now is a good time to highlight the stocks that have historically performed the best following their Q1 reports. Below is a list of stocks with market caps above $5 billion that have historically performed the best in reaction to their Q1 earnings reports. To make the list, the stock had to have at least 8 years of Q1 reports, so these stocks have been consistently positive during Q1 for a long time.
Please log-in or start a free membership trial to continue reading this report…
