Aug 12, 2016
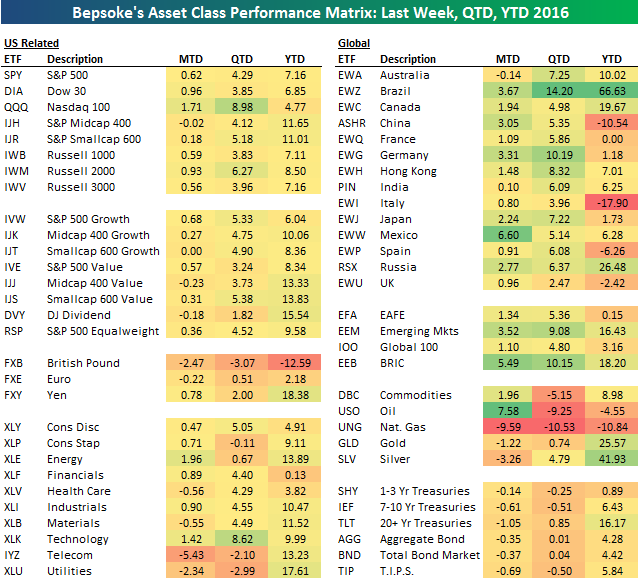
Below is an updated look at our asset class performance matrix using key ETFs traded on US exchanges. For each ETF, we show its performance month-to-date, quarter-to-date, and year-to-date. The Technology sector (XLK) and the Nasdaq 100 (QQQ) are big standouts to the upside so far in the third quarter, both with gains of more than 8.5%. Energy (XLE) has had a nice August so far with a gain of 1.96%, while Brazil (EWZ) continues to move sharply higher as it has done all year. Treasury ETFs are now down across the board month-to-date, but they’re still in the green for the year.
We analyze asset class performance, earnings season, economic indicators, sentiment and more in this week’s Bespoke Report newsletter. We also pack a ton of additional analysis into this week’s 30+ page report. You can read the entire thing by starting a 14-day free trial to our paid content below.
Have a great weekend!
Aug 5, 2016
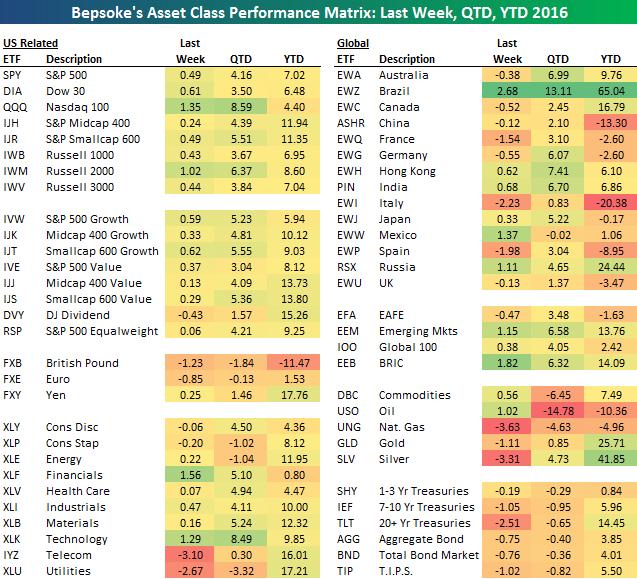
After trading within a high/low range of less than 1% over the last three weeks, the S&P 500 finally broke higher again today due to a nonfarm payrolls print this morning that was much better than expected. As you can see in our asset class performance matrix below, US equities were led higher by Technology (XLK) and Financial (XLF) stocks this week. Telecom and Utilities — two very defensive sectors — lagged behind. Treasury ETFs had a rough week as well as interest rates begin to tick higher.
We analyze today’s jump for stocks following a much stronger-than-expected jobs number in this week’s Bespoke Report newsletter. We also pack a ton of additional analysis into this week’s 30+ page report. You can read the entire thing by starting a 14-day free trial to our paid content below.
Have a great weekend!
Jul 29, 2016
After an epic surge off the post-Brexit lows that took the S&P 500 to new all-time highs, the rally has been stopped dead in its tracks over the last two weeks. But investors will take a flat market over a down market any day of the week!
To highlight just how flat this market has been, below is a chart showing the rolling 10-day high/low spread for the S&P 500 since the start of the bull market. Over the last ten trading days, the index has traded in a range of just 0.52%! That’s not only the lowest reading we’ve seen during the current bull market — it’s also the lowest reading we’ve seen since 1965!
We analyze prior periods of unprecedented flatness in this week’s Bespoke Report newsletter. We also pack a ton of additional analysis into this week’s 39-page report. You can read the entire thing by starting a 14-day free trial to our paid content below.
Have a great weekend!

Jul 22, 2016
It’s amazing how things can change in such a short period of time. Four weeks ago today, global markets were more chaotic than perhaps any other time since the Financial Crisis in 2008 in the aftermath of the Brexit referendum. On that day, every one of the 25 largest global benchmark indices we track that were open for trading were down on the day. The sell-off from that Friday followed through to the following Monday, and for the US it was an epic reversal in such a short period of time. In the span of two trading days, the S&P 500 went from 1.6 standard deviations above its 50-DMA to 3.2 standard deviations below. In the index’s entire history, there has never been a larger decline in the index’s OB/OS reading in that short a period of time.
As if that move wasn’t major enough, the rebound that followed was nearly as monumental. In the span of ten trading days, the S&P 500 went from 3.2 standard deviations below its 50-DMA to 2.5 above. That 5.7 point ten-day move in the index’s OB/OS reading was only eclipsed one other time in the S&P 500’s history, and that was 8/23/1982. If you know anything about market history, you know that August 1982 was a good time to get long equities.

So, how does the S&P 500 follow-up a twelve trading day period where it saw the most extreme two-day downside move and the second largest ten-day upside move? Like a little kid coming off a sugar high, volatility has seen an outright collapse. After closing above 25 on 6/24, the VIX closed below 12 this past Tuesday, marking the quickest decline from a 25+ reading down to a sub 12 reading on record. Welcome to the dog days of summer!
You’ve just read the introduction to this week’s Bespoke Report newsletter. You can read the entire thing by starting a 14-day free trial to our paid content below.
Have a great weekend!
Jul 15, 2016
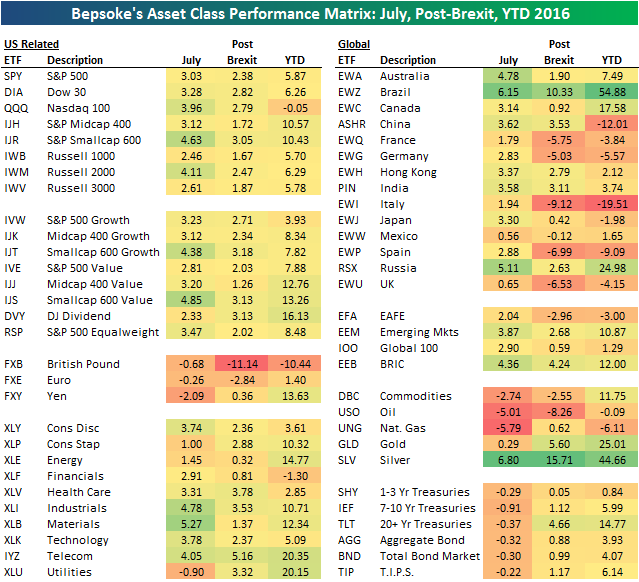
Below is an updated look at our asset class performance matrix using key ETFs traded on US exchanges. For each ETF, we highlight its percentage change so far in the month of July, its change since the close prior to the Brexit vote on June 23rd, and its year-to-date change. Industrials (XLI) and Materials (XLB) have been the top performing sectors in July, and both are now up more than 10% year-to-date. The Financial sector (XLF) is the only one still in the red for the year. Outside of the US, Brazil (EWZ) had another huge week with a gain of 6.15%. For the year, EWZ is now up 54.88%. That’s even better than Silver (SLV), which is now up 44.66%.
Each week, Bespoke sends clients across all of its subscription levels the Bespoke Report newsletter. If you’re looking for Bespoke’s analysis of current market internals, economic data, earnings beats and misses, individual stock ideas, and more, the Bespoke Report has it all.
Continue reading this week’s Bespoke Report by starting a 14-day free trial to our paid content below.
Have a great weekend!
Jul 8, 2016
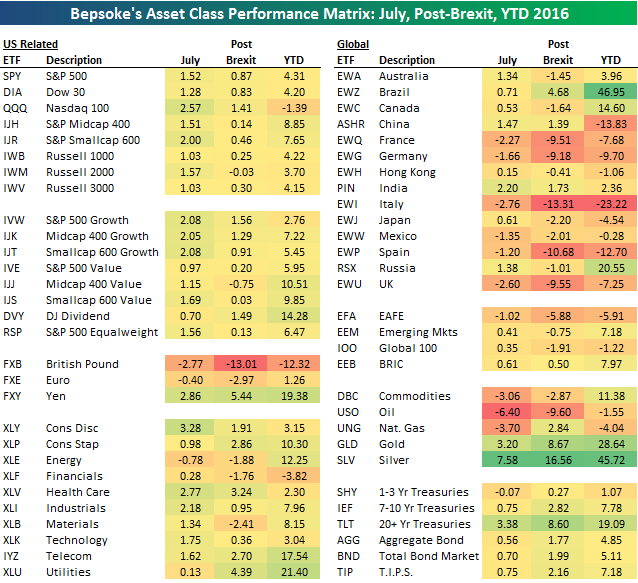
Below is an updated look at our asset class performance matrix using key ETFs traded on US exchanges. For each ETF, we highlight its percentage change so far in the month of July, its change since the close prior to the Brexit vote on June 23rd, and its year-to-date change. Silver is certainly shining in 2016!
Each week, Bespoke sends clients across all of its subscription levels the Bespoke Report newsletter. If you’re looking for Bespoke’s analysis of current market internals, economic data, earnings beats and misses, individual stock ideas, and more, the Bespoke Report has it all.
Continue reading this week’s Bespoke Report by starting a 14-day free trial to our paid content below.
Have a great weekend!
