The Bespoke Report: “I am the Stock Market King!”
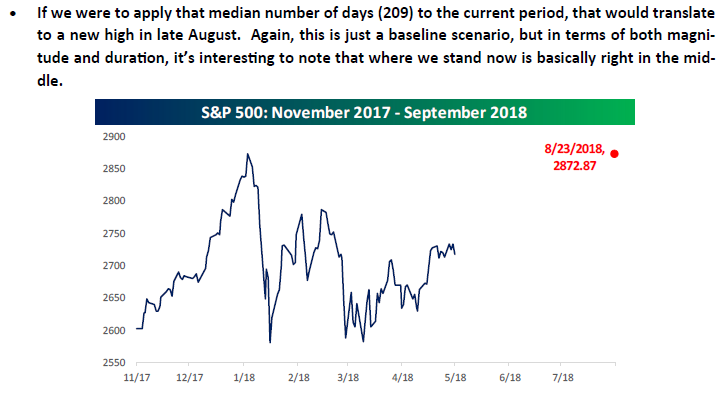
In our Bespoke Report dated 5/25/18, we provided the following chart and comments in our discussion of market corrections modeling that the S&P 500 would close at an all-time high again on 8/23/18. With the S&P 500 finally closing at an all-time high on Friday, we ended up being off by a day, but we’ll take it!
We’ve just published our latest weekly Bespoke Report newsletter, which is available to subscribers across all three of our membership levels. Sign up here to read the report.
To get up to speed on our thoughts regarding the market’s direction going forward, choose any membership option and access this week’s full Bespoke Report newsletter after signing up! You won’t be disappointed. Some of the topics discussed in this week’s report include:
- Comparison between now and 2000
- Housing starts to roll over
- The US economy and the global slowdown
- Decade-low readings in the yield curve
- Some attractive Financial sector stocks
- Market performance leading up to the mid-terms
- High yield breaks through a key level
- Sector breadth
- An exceptionally consistent Spring and Summer
- US vs ROW for the rest of year
- New highs- what now?
- Dividend Model Portfolio Update
The Bespoke Report – Need Mo-mentum
This content is for members onlyThe Bespoke Report – The Calm Breaks
This content is for members onlyThe Bespoke Report — Apple Breaks a Trillion, Propels S&P Higher
This content is for members onlyThe Bespoke Report: Hanging in There
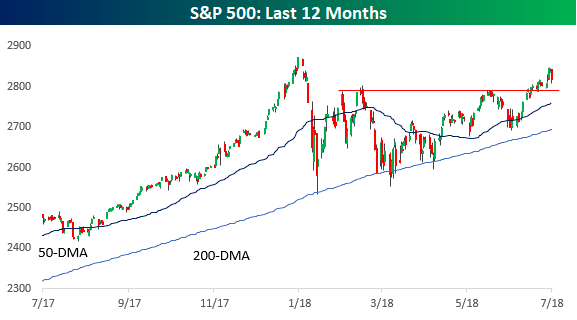
We’ve just published our weekly Bespoke Report newsletter, which is available to subscribers across all three of our membership levels. Sign up here to read the report. Looking at the S&P 500’s chart right now, it’s sitting right in the middle of a “DMZ” zone with former resistance at 2,800 to the south and the January highs to the north.
To see which way we think the market will eventually break, choose any membership option and access this week’s full Bespoke Report newsletter after signing up! You won’t be disappointed. Some of the topics discussed in this week’s report include:
- Changing relative strength trends
- How “Thin” the rally really is
- Stock vs Treasury relative strength
- What’s in store for emerging markets and Brazil
- Full earnings season analysis
- How tariffs are impacting quarterly results
- Housing’s tough week
- Fedspeak Monitor
- Seasonality trends for August and the rest of the year
- Sentiment update
- Update on market internals