May 19, 2026
Log-in here if you’re a member with access to the Closer.
- Moves higher despite negative breadth have been a feature of the rallies in both the broad market and our Best of Breed basket.
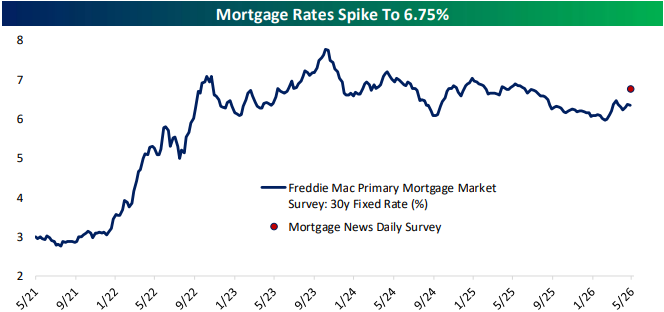
- As the surveyed 30 year mortgage rate reached 6.75%, 10y real yields have surged 17 bps in three sessions.
- Delinquency and charge off rates for all loans and credit cards have improved, but rates for commercial and industrial loans hit multi-year highs.
See today’s full post-market Closer and everything else Bespoke publishes by starting a 14-day trial to Bespoke Institutional today!
May 19, 2026
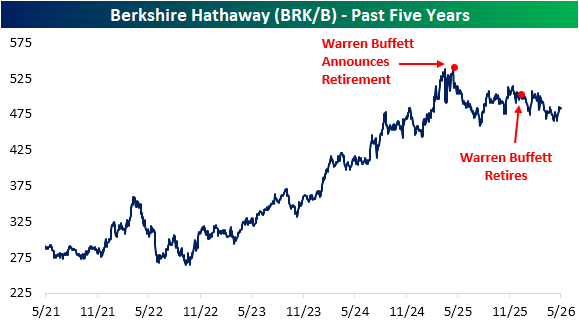
It has now been just over a year since legendary investor Warren Buffett announced that he would be retiring. That announcement came at the annual shareholder meeting, and Berkshire Hathaway (BRK/B) has struggled ever since. That is not to say it has been a falling knife, but as shown below, what had been a strong multi-year uptrend was stopped dead in its tracks after Buffett’s announcement. Since he officially retired at the end of 2025, the stock has continued to see the same choppy price action that it saw in the months prior.
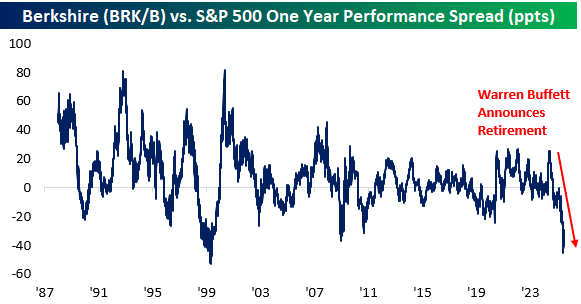
Of course, the rest of the market has charged ahead without BRK/B, an impressive feat considering it is one of the market’s largest stocks. As shown below, it is unprecedented to see this sort of underperformance versus the S&P 500. BRK/B has underperformed the S&P 500 year over year by around 30 percentage points. At the recent peak on April 22, that spread stood above 45 percentage points. The only other period with a wider spread was March 2000.
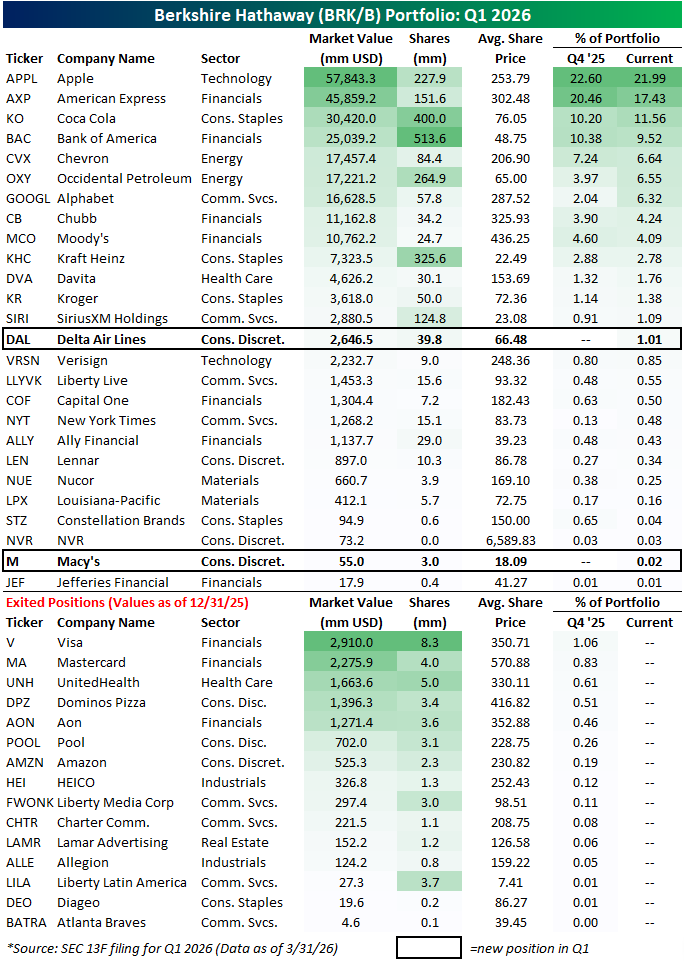
The quarterly 13F filing for Berkshire Hathaway (BRK/B) has now been released, highlighting the company’s holdings through the end of the first quarter, which is the first full quarter under new CEO Greg Abel.
In the table below, we list out Berkshire’s holdings in the 13F through the end of Q1 in addition to those positions that were exited relative to Q4 2025.
Notably, the company also holds positions in a handful of Japanese stocks. Given those are international equities, they do not appear on 13F filings and calculations of shares of the portfolio exclude those international names.
As shown below, there were a solid number of stocks that were part of the portfolio at the end of last year that were exited this past quarter.
The most notable of those is perhaps Amazon (AMZN) when it comes to market cap, however it was a relatively small position to begin with. In fact, of the stocks that the company exited, Mastercard (MA) and Visa (V) were the largest and only the latter accounted for more than 1% of the portfolio.
Currently, peer credit card company American Express (AXP) is the second largest holding at 17.4%; second only to Apple (AAPL).
The two new additions to the portfolio in Q1 were Delta Airlines (DAL) and Macy’s (M). Of these two, Macy’s is still a negligible position, whereas Delta is just over 1%.
Like this analysis? Join our Think BIG mailing list to receive an interesting market stat in your inbox a few times per week. Click below to sign up:

May 18, 2026
Log-in here if you’re a member with access to the Closer.
- Agricultural commodities have begun to breakout after a long term triple bottom.
- Urea prices have begun to fade as phosphate prices have begun to inflect higher.
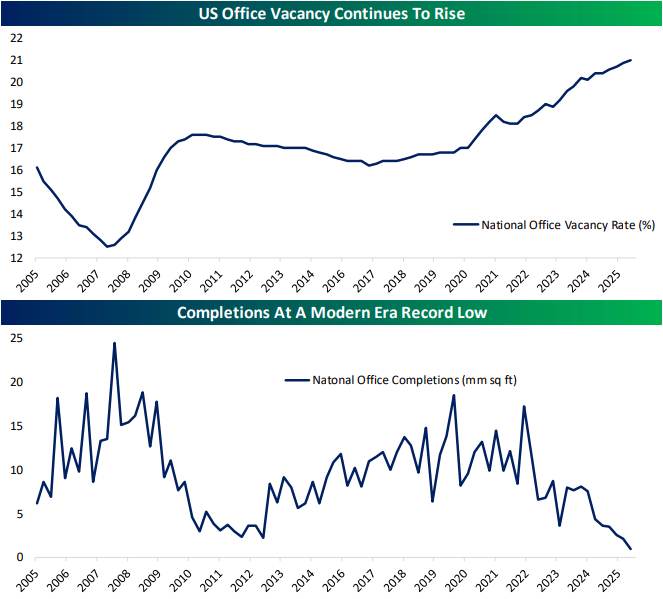
- US office vacancy rates hit a new record high of 21% in Q1 while office completions have fallen to a record low
See today’s full post-market Closer and everything else Bespoke publishes by starting a 14-day trial to Bespoke Institutional today!
May 15, 2026
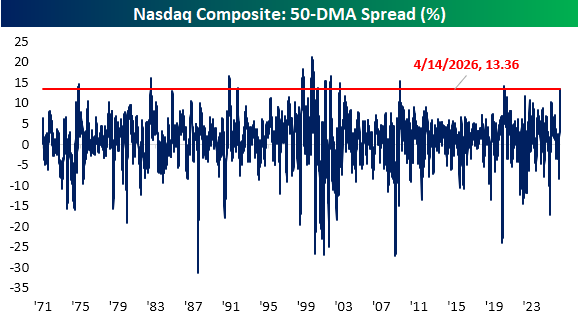
The sharp rally off of the March 30th low has seen the Nasdaq climb 25.9%. Back at the time of the low, the Nasdaq was extremely oversold, trading 2.85 standard deviations below its 50-DMA. In percentage terms, the Nasdaq was down 8.4% below that same moving average, which was a lot, but far from any sort of record setting reading.
Fast forward to yesterday’s close, the opposite was true. While the index wasn’t even extremely overbought (only 1.9 standard deviations above its 50-DMA), it did finish 13.4% above its 50-DMA for the most extended reading since June 2020. Going back throughout the over 50 years of history of the index, such extreme readings in the 50-DMA spread have been uncommon. Prior to the 2020 instance, the only other times it traded as far above its moving average was in 2009, various points in the 1990s to the Dot Com bubble burst in the early 2000s, 1982, and 1975.
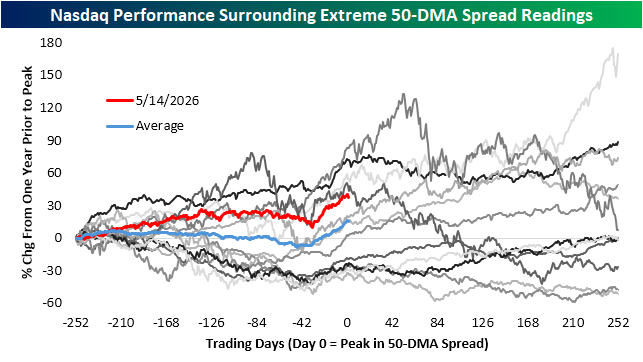
In the chart below, we show how the Nasdaq performed in the one year before and after those historic peaks in the 50-DMA spread. For each line below, day 0 indicates the peak reading in the 50-DMA spread. As shown, of the dozen previous periods, the Nasdaq has been higher versus one year prior seven of the times. This latest rally ranks as the fifth largest of those at 40%. Only the 1992, 1999, and 2000 instances saw bigger gains. Of those periods with larger gains, the following year only saw the index higher twice (up 9.5% after the 1992 instance and 75% after the January 1999 instance) whereas the others were more immediately leading up to the early 2000 Dot Com peak.
Like this analysis? Join our premium members by starting a trial today! Click below for details on how to sign up:

May 15, 2026
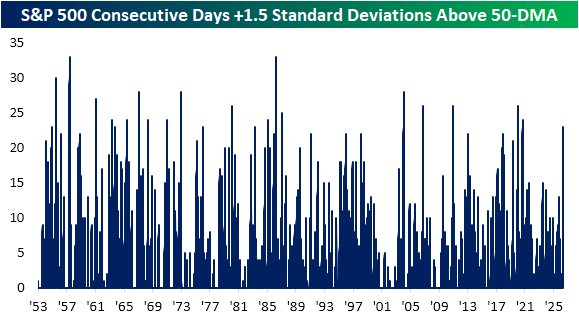
Although the index is lower to round out the week, the S&P 500 repeatedly reached more record highs recently. With the rally largely unabated, the index has been in overbought territory (> one standard deviation above its 50-DMA) every single session since April 14th. Not only has the S&P been overbought, but firmly so. Of the 24 consecutive sessions in overbought territory, the past 23 have seen the index close at least 1.5 standard deviations above its 50-DMA.
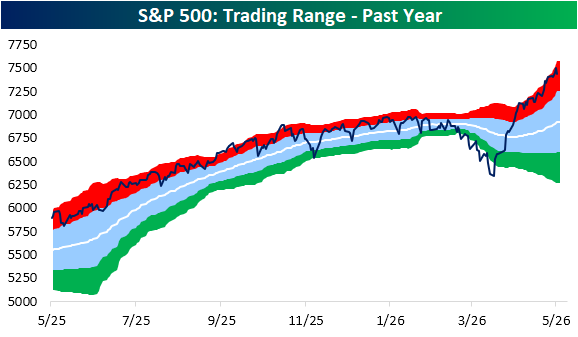
As shown below, this is now the longest streak of firmly overbought readings (consecutive trading days with the index at least 1.5 standard deviations above its 50-DMA) since September 2020. Looking back to the start of the 5-day trading week in 1953, there have been a total of 22 other streaks of at least 23 days. The longest of these extended to 33 straight sessions in March 1983 and May 1967.
Like this analysis? Join our premium members by starting a trial today! Click below for details on how to sign up: