The Trillionaires Gain a New Member
The S&P 500 is on pace to close at fresh record highs today on positive breadth. Once again, it is the AI trade powering the move as several of the index’s biggest gainers are out of the semiconductor space.
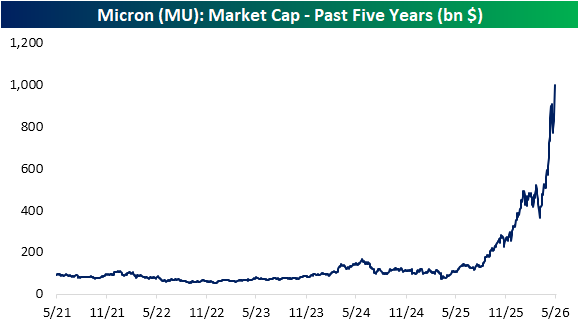
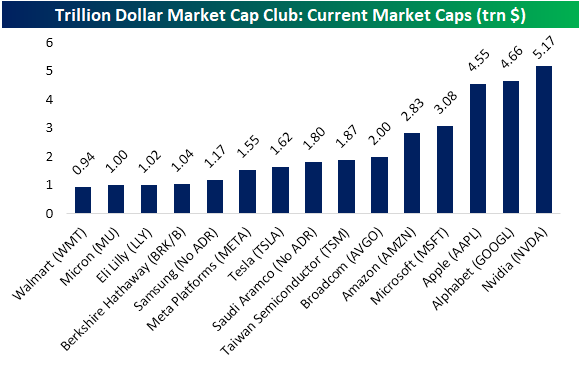
The single biggest gainer, up over 19% as of this writing, is Micron (MU).
An upgrade by UBS that saw a tripling of MU’s price target is being deemed the catalyst for today’s surge in the memory and data storage producer, and that is enough to also lift it above a $1 trillion market cap for the first time.
A year ago, MU’s market cap was just $100 billion, and it was at $62 billion when ChatGPT was released in late 2022.
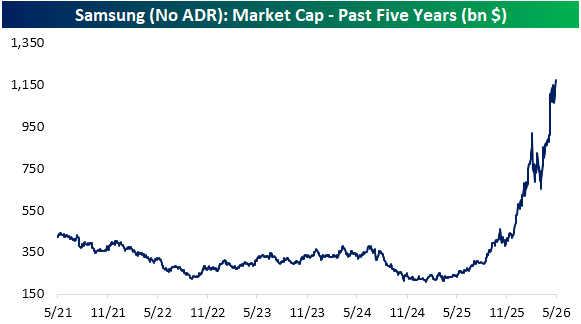
MU is not the only memory chip maker to reach a $1 trillion market cap. On a US dollar-adjusted basis, Samsung, which trades in South Korea, eclipsed that threshold for the first time on May 6th.
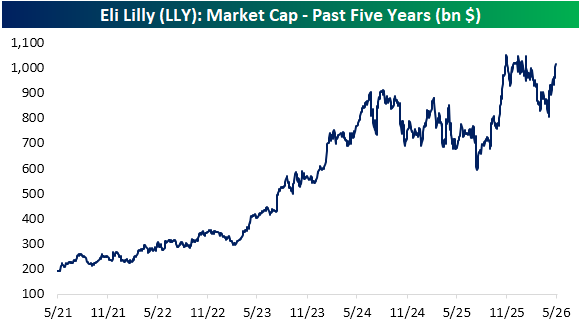
Looking at other stocks with market caps above $1 trillion, Eli Lilly (LLY) has also re-joined the club.
With the addition of MU, there have now been 15 US and international stocks to hit the $1 trillion threshold (shown below).
Want more from Bespoke? You can start by joining our Think BIG mailing list where you’ll receive an interesting market stat in your inbox a few times per week. All we need is your email address. Join now by clicking here or on the image below.