Mar 2, 2022
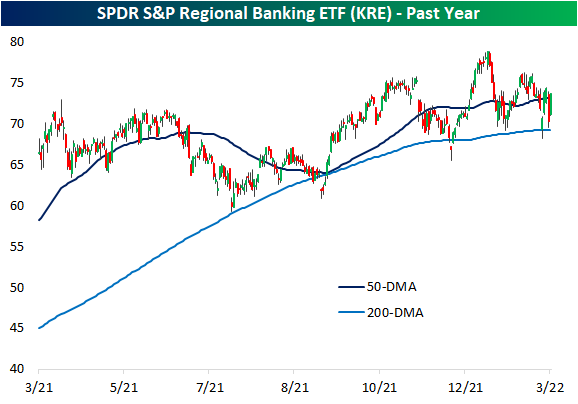
While Financials are the best performing sector so far in today’s session, leading into today it was the worst-performing sector over the past week thanks in large part to a 3.7% decline on Tuesday; the sector’s worst single day since June 2020. Looking more specifically at bank stocks, using the SPDR S&P Regional Banking ETF (KRE) as a proxy, yesterday saw an even more dramatic decline of 5.47% marking the largest decline since November 2020. That drop also ranks in the bottom 1% of all daily changes on record since the ETF began trading in 2006. The over 3.5% rebound today, meanwhile, ranks in the top 5% of all days on record as yesterday’s decline was not quite enough to drop the industry below its 200-DMA; a support level that has now held multiple times in the past year.

As previously mentioned, it is rare for KRE to fall over 5% in a single day. Excluding yesterday, there were 68 other times this happened but only a dozen of those occurred with at least 3 months between the prior instance. In the table below, we show the performance of KRE after each of those periods.
While it is far from the case today, typically, the next day has often seen KRE fall further after a 5% drop. Instead, today it is seeing the second-best next-day performance of these instances. As for where things go from here though, returns have been weaker than the norm one week and one month following these past occurrences. KRE has then tended to outperform all other periods three, six, and twelve months out. Click here to view Bespoke’s premium membership options.

Mar 2, 2022
While the past week has seen Treasury yields fall sharply, mortgage rates have continued to rise as has been the case consistently over the past few months with the FOMC slated to begin raising rates. At current levels, various measures on the national average for a 30-year fixed-rate mortgage like the longer-dated weekly series from Freddie Mac or the higher frequency series from Bankrate.com have now reached the highest levels since 2019. For the rate from Freddie Mac, as of the most recent update last Thursday, the national average for a 30-year fixed-rate mortgage stood at 3.89%. For the more recent and higher frequency reading from Bankrate.com, each day of the past week has seen readings at or above 4.25%.

As previously mentioned, the recent changes in US Treasuries have been the opposite of mortgage rates. Quantifying this, in the ten days since the February 15th high in the 30-year US Treasury, the yield has fallen 25.26 bps through yesterday’s close. Meanwhile, the 30-year fixed-rate mortgage from Bankrate.com has risen 6 bps. For mortgages, that is far from the largest 10-day change as that reading recently was above 40 bps in mid-February, but regardless, relative to the decline in the 30-year yield, yesterday saw a 31 basis point spread between the two rates’ 10-day changes. As shown in the chart below, that stands in the 98.8th percentage of all periods going back to the start of the mortgage rate data in 1998. June of last year and the COVID crash were the most recent periods to see such a divergence in the moves in 30 year Treasury and mortgage rates.

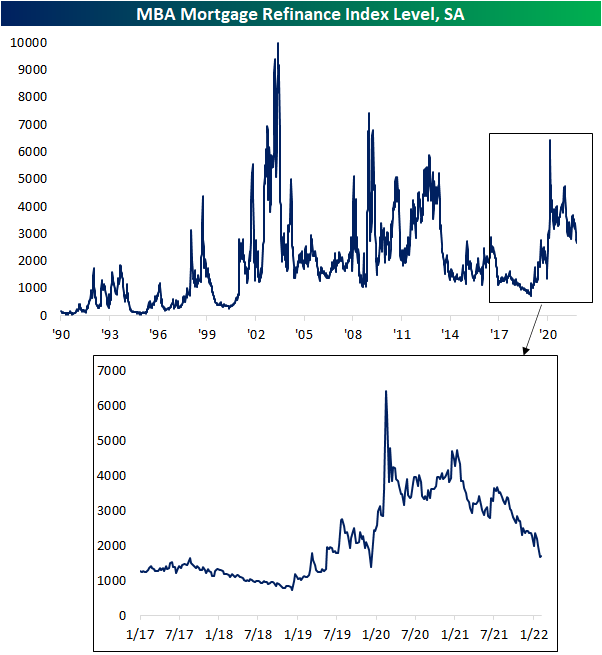
Given it continues to get more expensive to finance a home, purchase applications from the MBA fell again this week (albeit the 1.76% WoW decline was far less severe compared to the previous week’s 10.14% decline) as the index is now at the lowest level since May 2020.

Refinance applications were actually slightly higher this week, but in spite of that small respite, the index still hovers around some of the lowest levels of the past two years. Click here to view Bespoke’s premium membership options.
Mar 1, 2022
Log-in here if you’re a member with access to the Closer.
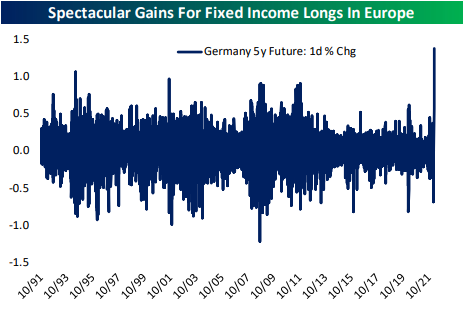
Looking for deeper insight into markets? In tonight’s Closer sent to Bespoke Institutional clients, we begin with a look across a handful of the dramatic moves in markets including the change in the 10-year TIPS yield, WTI curve, high yield spreads and the VIX. After recapping earnings and Ukrain news, we then dive into the historic move in European fixed income markets. We also look across the massive returns year to date across a variety of commodities, finishing with a look at the huge gains in clean energy stocks.
See today’s post-market Closer and everything else Bespoke publishes by starting a 14-day trial to Bespoke Institutional today!
Mar 1, 2022
Please click the image below to view our March 2022 market calendar. This calendar includes the S&P 500’s average percentage change and average intraday chart pattern for each trading day during the upcoming month. It also includes market holidays and options expiration dates plus the dates of key economic indicator releases. Start a two-week free trial to one of Bespoke’s three research levels.
