Investor Sentiment Remains Volatile
Considering equities and other risk asset prices continue to swing violently, so too have readings on investor sentiment. The weekly AAII survey of individual investors saw the percentage of respondents reporting as bullish fall back below 25% this week after rising above 30% last week. While that is not the largest drop in recent months (the second week of January saw bullish sentiment fall 7.9 percentage points compared to 6.4 today), it nonetheless reaffirmed that investor confidence is shaky, if not undecided, at the moment.

The drop in bullish sentiment was mostly picked up by those reporting as bearish. Bearish sentiment rose 4.4 percentage points to 45.8%. While that reading is roughly 15 percentage points above the historical average for bearish sentiment, the reading is still lower than an even more pessimistic reading only two weeks ago when more than half of respondents reported as bearish.
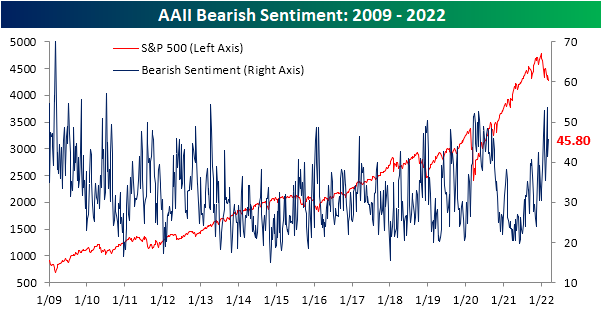
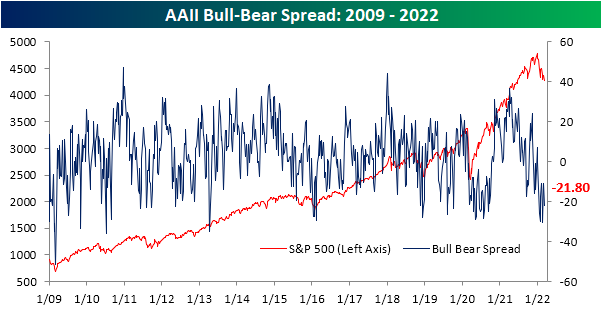
With the inverse moves in bullish and bearish sentiment, the bull-bear spread has pulled back to -21.8. As with bullish and bearish sentiment, even if that does not set a new low, it is only in the 5th percentile of readings going back to the start of the survey.
After the largest single-week decline in nearly 20 years two weeks ago, neutral sentiment has been clawing its way back into the range it was in for most of the past year. Gaining another 2 percentage points this week, the reading is now back above 30%.

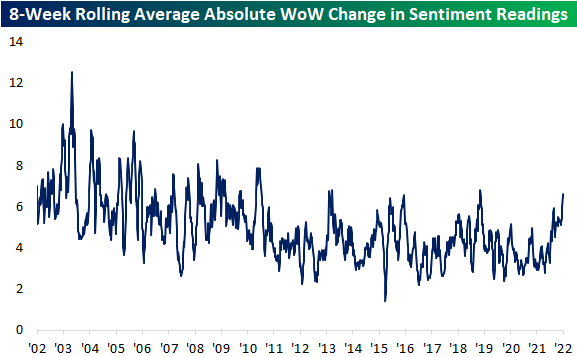
Across each category of the report, there have been sizable swings in the past two months. To highlight this, in the chart below we show the eight-week rolling average of the absolute week over week change for each sentiment reading (bullish, bearish, and neutral) over the past 20 years. Over the history of the survey, weekly changes have gravitated towards smaller swings meaning the past decade is structurally a bit different relative to the decade before that. That being said, the weekly swings in the AAII readings on sentiment have been some of the largest of any period of the post-Global Financial Criss era. In fact, not even the COVID crash saw such volatility in sentiment (given optimism collapsed and then remained muted for some time rather than swing back and forth) while the only times this average was as high as now in the past decade were the spring of 2013, February 2016, and January 2019. Click here to view Bespoke’s premium membership options.
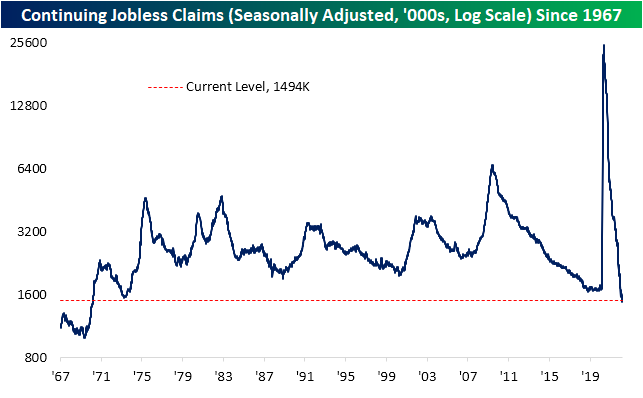
Little Need to Worry About Rising Claims
While today’s CPI data did not come in hotter than expected as feared (matching expectations of 7.9% YoY growth), jobless claims came in worse than expected for both initial and continuing claims. Seasonally adjusted initial claims rose to 227K versus expectations of a 2K increase from last week’s unrevised level of 215K. In addition to the higher reading this week, the last print was also revised up by 1K. In spite of the lack of improvement in claims recently (it’s been over 3 months since the multi-decade low of 188K set in early December), the level of claims remains historically low.
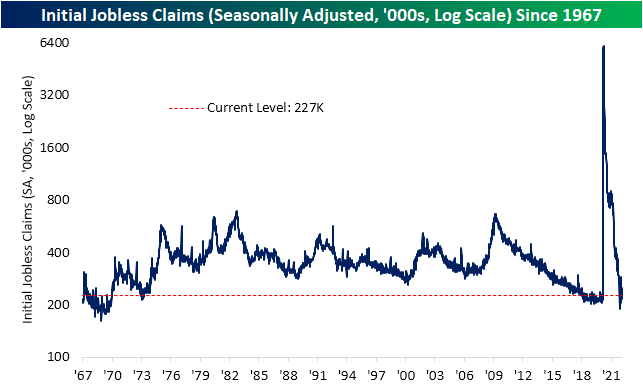
On a non-seasonally adjusted basis, claims for the current week of the year are in line with readings from the few years prior to the beginning of the pandemic. In terms of the seasonal pattern, the current week of the year typically has not seen claims rise week over week as they did this year. Claims tend to fall at this point of the year with the few weeks surrounding the current period marking some of the weeks of the year with the most consistent declines in claims. Regardless of the somewhat seasonally unusual move, the broader seasonal pattern this year has not marked a major divergence versus history.

Continuing claims were expected to fall from 1.476 million down to 1.450 million. Instead, claims rose by 18K. As with initial claims, even though that is not as strong a reading as anticipated. It is far from leaving claims at any sort of worrisome level.Click here to view Bespoke’s premium membership options.
The Closer – Don’t Go Chasing Oil Falls, Mean Reversion Madness, JOLTS – 3/9/22
Log-in here if you’re a member with access to the Closer.
Looking for deeper insight into markets? In tonight’s Closer sent to Bespoke Institutional clients, we begin tonight with some comments on the recent events in oil markets and the moves in used car prices. We then review this week’s EIA data followed by a decile analysis showcasing today’s mean reversion. After reviewing JOLTS data we recap today’s 10-year note reopening.

See today’s post-market Closer and everything else Bespoke publishes by starting a 14-day trial to Bespoke Institutional today!