Jun 10, 2022
Bespoke’s Crypto Report contains numerous technical, momentum, and sentiment charts for bitcoin, ethereum, and other key cryptos. Page 1 of the report includes our weekly commentary on the space and attempts to identify any new trends that are emerging. The remaining pages include important overbought/oversold levels to watch, charts on historical drawdowns and rallies, seasonality trends, futures positioning data, Google search trend shifts, and more. Our weekly Crypto Report is produced so that followers of the space can more easily stay on top of price action, technicals, seasonality, and sentiment.
Sign up for a monthly or annual subscription to Bespoke Crypto to receive our weekly Crypto Report and anything else we publish related to cryptos. Note: If you’re currently a Bespoke Premium, Bespoke Newsletter, or Bespoke Institutional subscriber, you’ll need to subscribe to Bespoke Crypto as an add-on to receive access. The weekly Crypto Report and any additional crypto analysis is not included with our Premium, Newsletter, or Institutional memberships. You can sign up for Bespoke Crypto and receive our Crypto Report in your inbox weekly using the monthly or annual checkout links below. If you sign up for the annual plan, the first year of access is 50% off!
Bespoke Crypto Access — Monthly Payment Plan ($49/mth)
Bespoke Crypto Access — Annual Payment Plan ($247.50 for the first 12 months, then $495/year in year 2 and beyond)

Bespoke Investment Group, LLC believes all information contained in this service to be accurate, but we do not guarantee its accuracy. None of the information in this service or any opinions expressed constitutes a solicitation of the purchase or sale of any securities, commodities, or cryptocurrencies. This service contains no buy or sell recommendations. This is not personalized advice. Investors should do their own research and/or work with an investment professional when making portfolio decisions. As always, past performance of any investment is not a guarantee of future results. Bespoke representatives or clients may have positions in securities discussed or mentioned in its published content.
Jun 9, 2022
Log-in here if you’re a member with access to the Closer.
Looking for deeper insight into markets? In tonight’s Closer sent to Bespoke Institutional clients, we begin tonight noting the differences between equity markets’ and other assets’ concerns over tomorrow’s CPI print as well as what jobless claims data is showing for the unemployment rate (page 1). Next, we dive into the Fed’s Flow of Funds report including a domestic debt breakdown, corporate leverage and interest burdens, and household wealth breakdowns (pages 2-5). Turning over to mortgage data, we show the latest delinquency rates as well as a look at state level non-current loan rates (pages 6-7). We close tonight’s note with a recap of the solid 30 year bond reopening held this afternoon (page 8).

See today’s full post-market Closer and everything else Bespoke publishes by starting a 14-day trial to Bespoke Institutional today!
Jun 9, 2022
In today’s Morning Lineup, we discussed the sideways range the S&P 500 has found itself in over the past eight trading days. With indecisive price action, sentiment—as measured by the AAII’s weekly survey— has been equally undecisive. After picking up substantially last week from 19.8% to 32.0%, the percentage of respondents reporting as bullish has reversed most of its gains coming in at 21.0% this week%

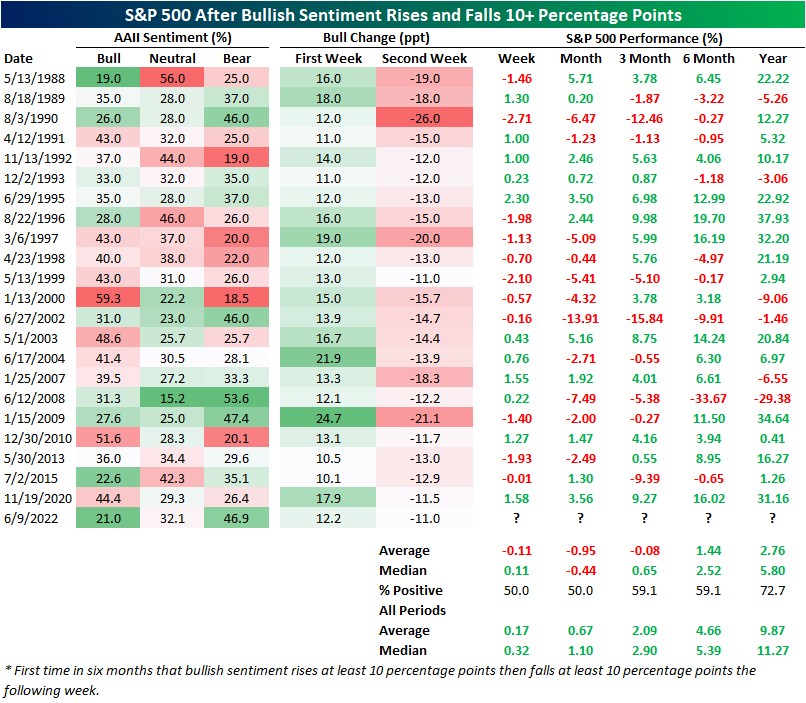
Back-to-back weeks of double-digit moves (either positive or negative for both weeks) in bullish sentiment are relatively rare with only about 4.6% of all weeks in the history of the survey dating back to 1987 seeing such a move. Of those, less than two dozen resemble this week with bulls rising by at least 10 percentage points in the first week followed by a 10 or more percentage point drop the next week for the first time in at least six months. The most recent occurrence (of any double-digit back-to-back moves) was over a year ago in November 2020 when bulls rose by an even larger 17.9 percentage points followed by an 11.5 point drop. We would also note that the current situation has the second-lowest reading in bullish sentiment of these past instances behind May 1988—roughly one year after the survey began—when it was two percentage points lower.
As we have frequently noted in the past, low bullish sentiment has actually tended to be a positive signal for forward performance of equities. Although that could pose an optimistic sign for the S&P 500 going forward, big swings up then down then have not tended to be the best sign for equities. As shown below, after similar moves in bullish sentiment, performance for the S&P 500 one week and month later has been positive only half the time with an average decline of 0.11% and 0.95%, respectively. While performance is more often than not positive three months later, the S&P 500 has averaged an 8 bps decline versus the norm of an average gain of 2.9%. Six and twelve-month performance is similarly more consistently positive but does not outperform the norm.
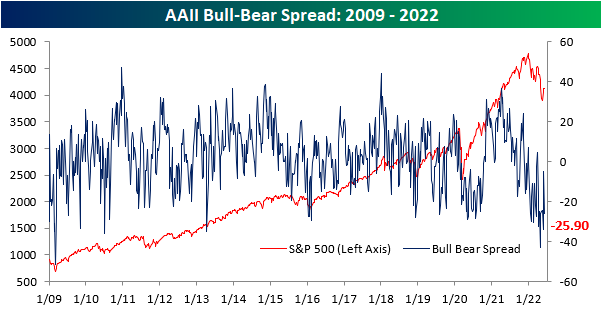
As bulls stepped back this week, bears recouped nearly 10 percentage points rising from 37.1% to 46.9%. While that is still below the readings above 50% observed throughout April and May, historically that is an elevated reading well above the historical average of 30.7%.

Given this, the bull-bear spread moved deeper into negative territory meaning bears continue to heavily outweigh bulls. Bears currently outnumber bulls by 25.9 percentage points. Again, that is a very low level albeit not as extreme as only a couple of weeks ago. Click here to learn more about Bespoke’s premium stock market research service.
Jun 9, 2022
Seasonally adjusted initial jobless claims came in well above expectations today rising from 202K to 229K. Only an increase of 4K had been penciled in by economist forecasts. Although that increase brings claims up to the highest level in about six months, looking back historically it is still within the range of readings in the few years prior to the pandemic and that is also well below the typical readings for much of the history of the data.

Turning over to non-seasonally adjusted claims, recent readings have been much less volatile. In fact, compared to the seasonally adjusted number whose 27K increase was the largest since July of last year, unadjusted claims experienced a meager 1K uptick relative to last week. While the 1K increase during the current week of the year is very much normal (since 1967 72% of the time the 23rd week of the year has seen NSA claims rise WoW), it wasn’t a particularly large increase. On average, the same week of the year has seen unadjusted claims rise 31K. With the caveat that it covered a holiday week and revisions are still possible, that basically means the bulk of the move this week in the adjusted number was due to that seasonal adjustment rather than a material increase in claims. Taking another look at the unadjusted number, the current week of the year is well below the readings for comparable weeks in the years before the pandemic. In other words, the non-seasonally adjusted number points to a bit more strength than the adjusted number leads on.

Taking another look at the effects of seasonal adjustment, below we show the current series for seasonally adjusted and unadjusted claims as well as the adjusted numbers but using 2019 seasonal factoring (essentially removing any impacts on seasonal adjustment of the outlier-like high readings of the pandemic). While there are some minor discrepancies like how the current series had been understating claims relative to 2019 factoring earlier this year and the 2019 factoring was much more volatile around the holidays last year, overall the adjusted series have tracked one another well indicating that the extremely elevated readings of 2020 and 2021 have not had a major impact in undermining the effectiveness of seasonal factoring.

As the unadjusted initial claims number saw little change, continuing claims—lagged an additional week to the initial claims number— were unchanged week over week. Remaining at 1.306 million, it continues to be the strongest reading in several decades. Click here to learn more about Bespoke’s premium stock market research service.
