Jun 28, 2022
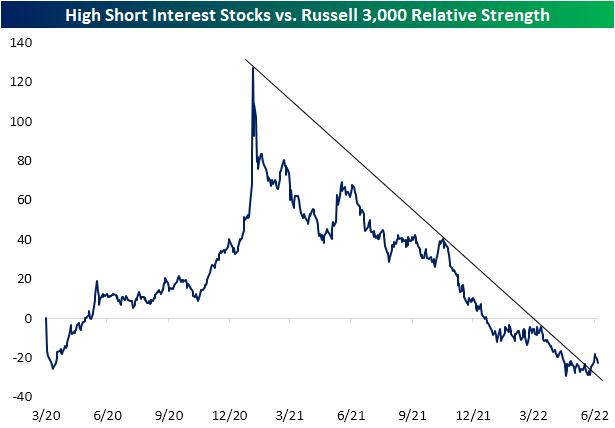
Alongside the broader equity market, the most heavily shorted names have likewise been rallying off their lows in the past several days (before today). As for how significant of a rally that has been, on a relative basis, the 100 most heavily shorted stocks versus the Russell 3,000 have broken out of the downtrend that has been in place since the height of the meme stock mania in January of last year.
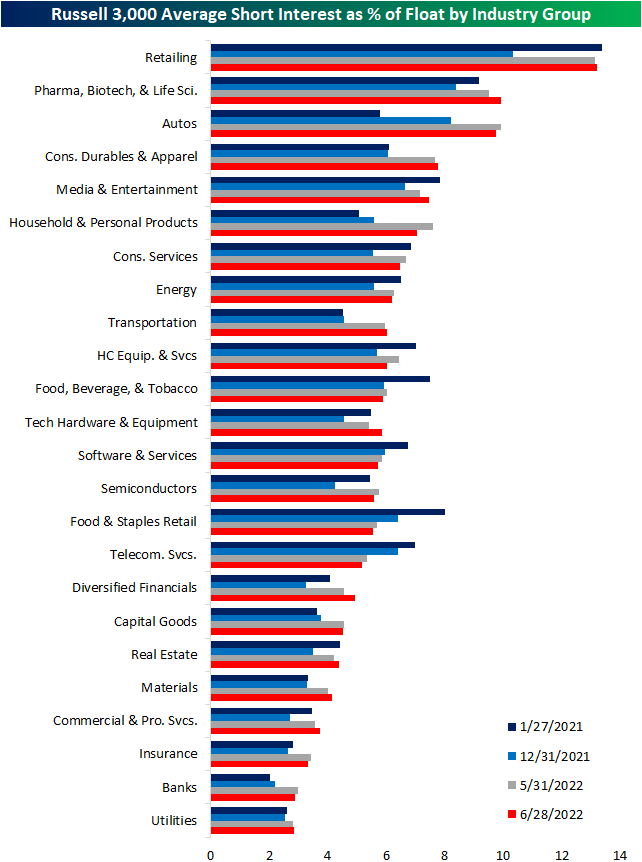
The latest short interest data as of June 15th was released yesterday, and the aggregate level of short interest for the whole of the Russell 3,000 rose from 5.1% of float as of the end of May to 5.67% in mid-June which is the highest level since last October. Below we show the average reading for the stocks of each industry group at various points in time since the historic short squeezes of January of last year. As shown, last year saw a general unwinding of short interest across industry groups, but the bear market this year has resulted in those readings starting to rise once again.
Some industries like Retail—which is also the industry with the highest average short interest reading—have seen their readings essentially return to Meme Stock Mania peak readings. Others like the Autos or Household and Personal Products industries are much more heavily shorted than they were a year and a half ago. That is not to say all industries have seen short interest rise. Food and Staples Retail, Software and Services, and Telecom Services, to name a few, currently have lower average readings on short interest than last year, at the end of last year, and the last report. In other words, while the aggregate level of short interest has been headed higher, there is some nuance as to which areas of the market have seen build-ups in short interest over the past year and a half.
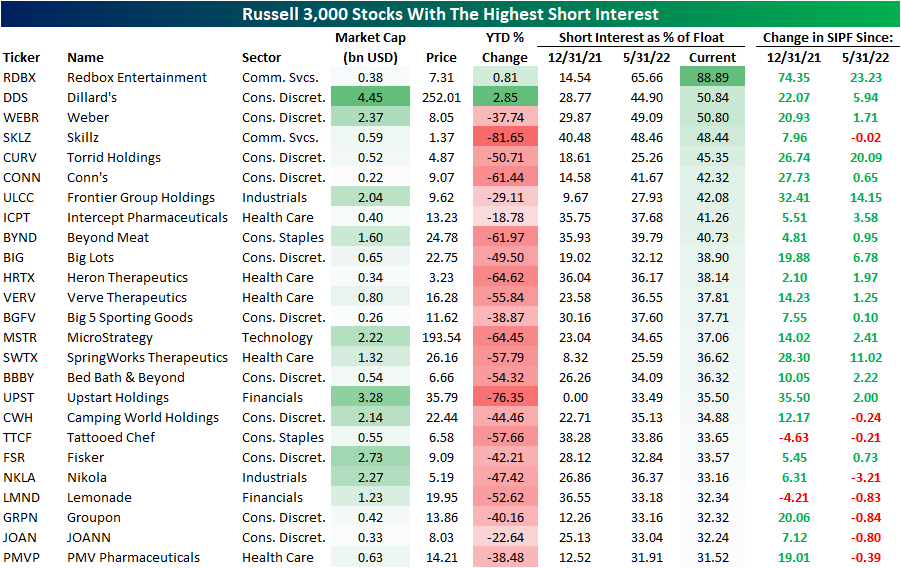
Taking a more granular look at which stocks in the index currently have the highest levels of short interest, recent SPAC, Redbox Entertainment (RDBX), tops the list with nearly 90% of its currently tradable shares sold short. Other than RDBX, there are only two other stocks with over half of float sold short: Dillard’s (DDS) and Weber (WEBR). While their short interest readings are similar, their performance year to date could not be more different. The former is one of the only names higher with a meager 2.85% gain whereas Weber (WEBR) has dropped 37.7%. Even though that is a huge decline, it is actually better than average for the whole of the 25 most heavily shorted names. The average decline year to date for this group is 45.8%. Although some names on this list have seen big increases in short interest between the latest updates, there are also a handful that have seen modest declines likely as existing shorts take profit following further declines. Click here to learn more about Bespoke’s premium stock market research service.
Jun 27, 2022
Log-in here if you’re a member with access to the Closer.
Looking for deeper insight into markets? In tonight’s Closer sent to Bespoke Institutional clients, we begin by showing the mean reversion that equities have been experiencing as well as the dynamic between growth and value (page 1). Next, we preview some of our Consumer Pulse data showing the dire outlook consumers have for the economy (page 2). We then update our Five Fed Manufacturing Composite (page 3) and we contrast that with hard manufacturing data (page 4). We close out with a look at this week’s Treasury issuance (page 5) and an update on some of the big shifts in speculator positioning (pages 6-8).

See today’s full post-market Closer and everything else Bespoke publishes by starting a 14-day trial to Bespoke Institutional today!
Jun 27, 2022
Economists were not anticipating a particularly strong Dallas Fed Manufacturing Activity reading as forecasts were calling for it to remain in contractionary territory at -6.5 (though that would have been an improvement versus last month’s -7.3 reading). Instead of the modest improvement that was expected, the index plummeted further hitting a new cycle low of -17.7. The region’s manufacturing economy experienced the largest decline in activity since the spring of 2020. Before that, 2016 was the last time this index was this low.
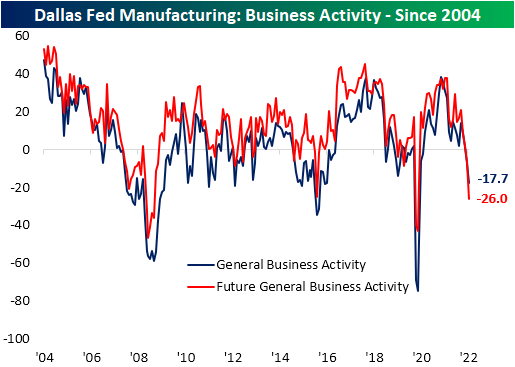
Looking across the categories of the report, there was little to like. Demand took a big hit with production slowing down in tow. Meanwhile, supply chains appeared to face increased stress contrary to other readings on that space over the past few months. Expectations painted a significantly soured outlook with several near record month-over-month declines as the indices reached low single digit percentile readings.

As mentioned above, Texas area manufacturers appeared to have reported a significant slowdown in demand as the index for New Orders dropped double digits and into the first contractionary reading since May 2020. Dropping hand in hand was the New Orders Growth Rate and Unfilled Orders. For the latter, the decline in expectations actually surpassed the spring of 2020 low and is now only one point above the December 2008 record low. Shipments was the only one of these indices to narrowly remain in expansion in June.

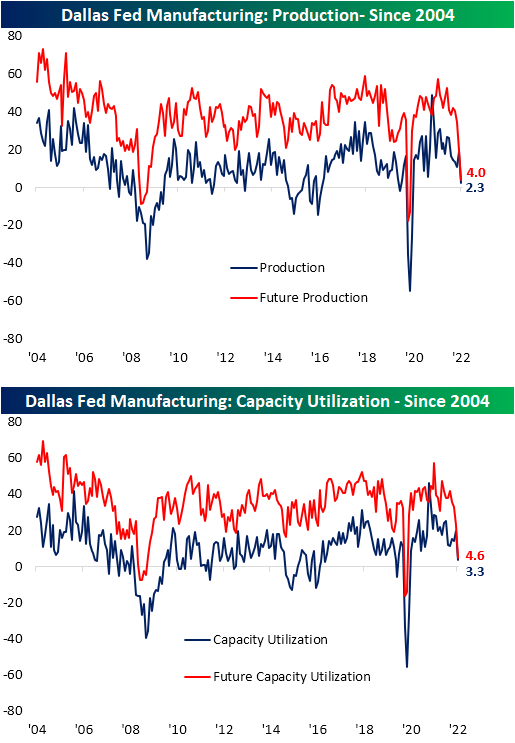
Manufacturers have quickly responded to that demand destruction by cutting back on production and capacity utilization. Expectations have seen even larger declines, although each of these indices, for the time being, remain at expansionary rather than contractionary levels.
High prices and long lead times have been thorns in the side of businesses throughout much of the pandemic, and for better or for worse, that trend appears to be turning around. Both Prices Paid and Received pulled back across expectations and current conditions in June. Both indices have now erased most of the moves higher since Q1 of last year.
Supply chain indices had a bit more puzzling and inconsistent of a print. After massive improvements last month that was echoed throughout several other data points external to this report, current conditions for Delivery Times returned right back up to where they were earlier this year. In fact, the 15.6 point month over month surge was the second largest on record behind the 21 point jump in March of last year. However, the expectations index lends some evidence that it may be a one-off increase. Expectations cratered with the largest one month decline on record. Not only was the move massive, but at -17.7, it is the lowest reading since March 2009. Inventories saw a similar move with current conditions indicating a large build in inventories as expectations called for a substantial decline further down the road. Given the weaker readings on New Order Expectations, that decline in Inventory Expectations is likely more of a function of expected improvements in supply chains.

Apart from the large declines across expectations indices, another indication of increased pessimism could also be found in the Outlook Uncertainty index. This is a more recent series included with the report dating back to only the start of 2018. As shown below, after spiking during the first half of 2020, it normalized up until last summer when it began to rise again, albeit more gradually. This month saw the index breakout in a big way as it experienced the second largest month-over-month increase on record behind March 2020. Click here to learn more about Bespoke’s premium stock market research service.

Jun 27, 2022
Cryptos have started off the new week with more declines as Bitcoin is down over 2.5% today and Ethereum has fallen nearly a full percentage point more. For both, those moves drive them deeper into oversold territory, which as we discussed in last Friday’s Crypto Report, is already an extended streak of oversold readings. For Bitcoin, today marks the 17th straight day trading at least one standard deviation below its 50-DMA. While it stands out from all oversold streaks going back to 2014, it is not the longest streak on record or even in recent months. In fact, before a brief stint within neutral territory, Bitcoin traded over one standard deviation below its 50-day for 25 straight days ending May 29th of this year and that followed another 32 day long streak that ended in February.
Although its history is not as long as Bitcoin, Ethereum has been trading in oversold territory for an even more impressive length of time. Today is the 54th oversold day which has far surpassed the previous record of 38 days. To add injury to insult, the prior record streak occurred earlier this year as Ethereum is now trading at a third of the price it was trading at to start the year. Click here to learn more about Bespoke’s premium stock market research service.
