Bulls Back Below 20%
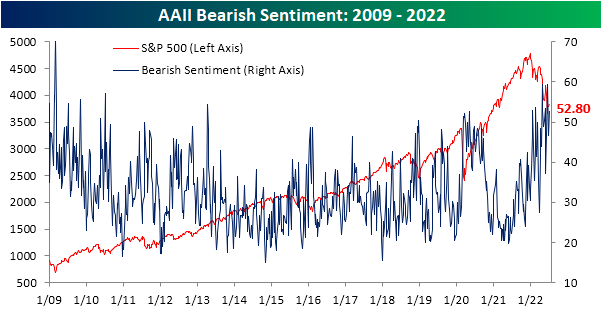
Even though the second half of June and first week of July have seen the S&P 500 climb back from its lows, sentiment appears to show that investors are not buying it. In today’s update of AAII sentiment survey, there was an overall push toward more bearish tones. For starters, the percentage of respondents reporting as bullish fell back below 20%. Even though that is not any sort of new low, this week is the fifth in a row with less than a quarter of respondents reporting as bullish. As shown in the second chart below, such a streak has been unprecedented with the last example of such an extended streak of depressed sentiment being May of 1993.


As bulls have been no where to be found, bears are plentiful with over half of respondents reporting bearish sentiment. This week’s reading came in at 52.8%, up from 46.7% last week. Mirroring bullish sentiment, that is not any sort of new pinnacle for bearish sentiment as there were even higher readings that closed in on 60% last month. Regardless, sentiment remains historically pessimistic with few other periods having seen such elevated readings for as extended of periods.
With inverse moves in bulls and bears, there is now a 33.4 percentage point gap between the two readings which is in the 2nd percentile of all readings since the survey began in 1987.

That leaves neutral sentiment to be the only normal reading of the survey. At 27.8%, neutral sentiment is in the middle of its pandemic range and only 3.6 percentage points below its historical average.

The more bearish turn at the expense of bulls witnessed in this week’s AAII survey was echoed by other readings on sentiment like the Investors Intelligence survey and NAAIM Exposure index. Combining all three of these sentiment readings into one composite, overall outlooks for the market took a further bearish turn this week with the average survey currently 1.8 standard deviations below its historical norm. That is slightly better than earlier this spring, but still, the only period since the mid-2000s with similarly pessimistic readings was in late 2008 and into 2009. Click here to learn more about Bespoke’s premium stock market research service.

Worst Week of the Year For Claims
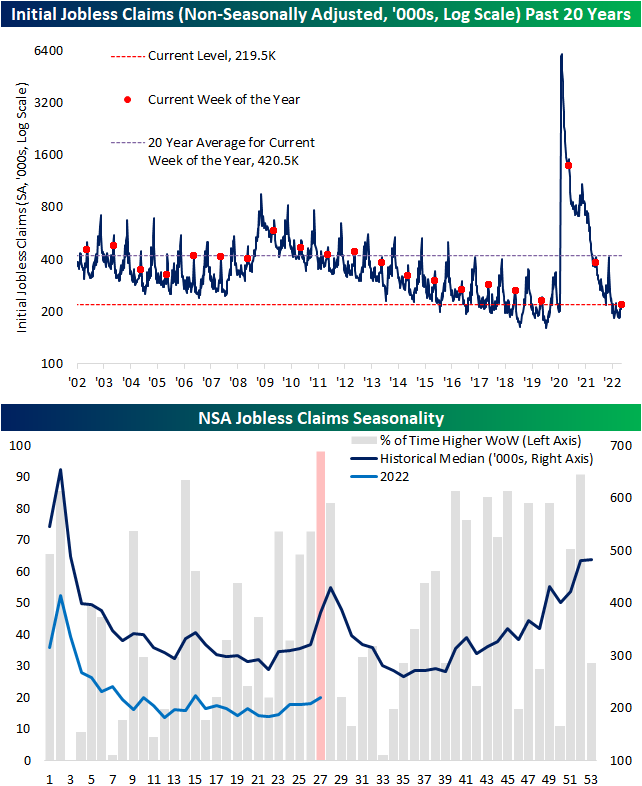
Initial jobless claims remain historically healthy in the low 200K range, but the most recent week’s data did mark one of the highest readings of the year. Coming off of last week’s unrevised 231K, claims rose 4K to the highest level since the second week of the year when they clocked in at 240K. That remains a much better reading than what was observed throughout much of the history of the data, but it is at the higher end of pre-pandemic readings (those from roughly 2017 through 2019).

As for the non-seasonally adjusted number, the current week of the year is essentially guaranteed to see a week-over-week increase. The current week has historically been the worst of the year in terms of week-over-week moves only having seen unadjusted claims fall once since 1967. That one decline was in 2020 when claims were working off unprecedented record highs. Given that historically consistent drift higher in claims during this point of the year, next week has historically averaged a temporary peak in claims. While that lends to the possibility of claims continuing to rise next week, the current reading is below that of comparable weeks of pre-pandemic years. In other words, claims are following standard seasonal patterns and are doing so at historically strong levels even if they have come off the absolute strongest levels of the pandemic.
Continuing claims have also begun to come off of the best levels of the pandemic. Adjusted continuing claims were expected to go unchanged at 1.328 million this week. Instead, they rose up to 1.375 million; the highest level since the week of April 22nd when claims were 12K higher. Click here to learn more about Bespoke’s premium stock market research service.

The Closer – Meaningless Minutes, Openings, Housing, Ag – 7/6/22
Log-in here if you’re a member with access to the Closer.
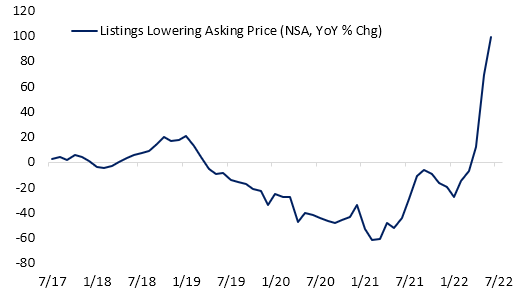
Looking for deeper insight into markets? In tonight’s Closer sent to Bespoke Institutional clients, we begin with a rundown of the minutes from the June FOMC meeting (page 1) followed by a look at job openings through today’s JOLTS report (page 2) and Indeed data (pages 3 and 4). We then pivot to housing data with the latest delinquency readings out of the Mortgage Monitor report from Black Knight (page 5) and realtor.com data covering inventories and prices (page 6). We then shift into the latest PMIs (page 7) before closing with a look into the declines in agriculture commodities (page 8).
See today’s full post-market Closer and everything else Bespoke publishes by starting a 14-day trial to Bespoke Institutional today!