Aug 12, 2022
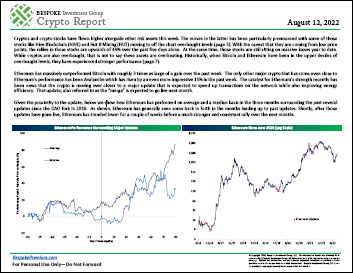
Bespoke’s Crypto Report contains numerous technical, momentum, and sentiment charts for bitcoin, ethereum, and other key cryptos. Page 1 of the report includes our weekly commentary on the space and attempts to identify any new trends that are emerging. The remaining pages include important overbought/oversold levels to watch, charts on historical drawdowns and rallies, seasonality trends, futures positioning data, Google search trend shifts, and more. Our weekly Crypto Report is produced so that followers of the space can more easily stay on top of price action, technicals, seasonality, and sentiment.
Sign up for a monthly or annual subscription to Bespoke Crypto to receive our weekly Crypto Report and anything else we publish related to cryptos. Note: If you’re currently a Bespoke Premium, Bespoke Newsletter, or Bespoke Institutional subscriber, you’ll need to subscribe to Bespoke Crypto as an add-on to receive access. The weekly Crypto Report and any additional crypto analysis is not included with our Premium, Newsletter, or Institutional memberships. You can sign up for Bespoke Crypto and receive our Crypto Report in your inbox weekly using the monthly or annual checkout links below. If you sign up for the annual plan, the first year of access is 50% off!
Bespoke Crypto Access — Monthly Payment Plan ($49/mth)
Bespoke Crypto Access — Annual Payment Plan ($247.50 for the first 12 months, then $495/year in year 2 and beyond)
Bespoke Investment Group, LLC believes all information contained in this service to be accurate, but we do not guarantee its accuracy. None of the information in this service or any opinions expressed constitutes a solicitation of the purchase or sale of any securities, commodities, or cryptocurrencies. This service contains no buy or sell recommendations. This is not personalized advice. Investors should do their own research and/or work with an investment professional when making portfolio decisions. As always, past performance of any investment is not a guarantee of future results. Bespoke representatives or clients may have positions in securities discussed or mentioned in its published content.
Aug 11, 2022
Log-in here if you’re a member with access to the Closer.
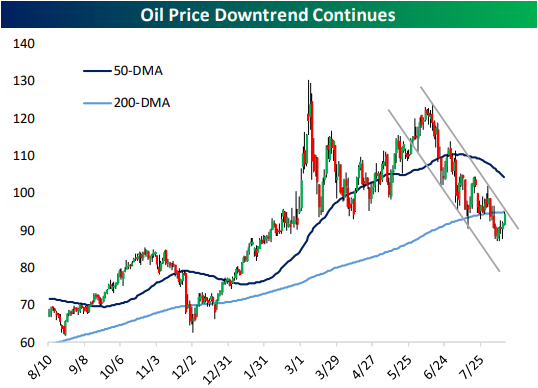
Looking for deeper insight into markets? In tonight’s Closer sent to Bespoke Institutional clients, we start things out tonight with a rundown of a handful of earnings and the persistent downtrend of crude oil prices (page 1). We then provide an overview of today’s producer price data (page 2 and 3) followed by a look at some measures on the market’s view of risk (page 4). We close with a recap of today’s long bond auction (page 5).
See today’s full post-market Closer and everything else Bespoke publishes by starting a 14-day trial to Bespoke Institutional today!
Aug 11, 2022
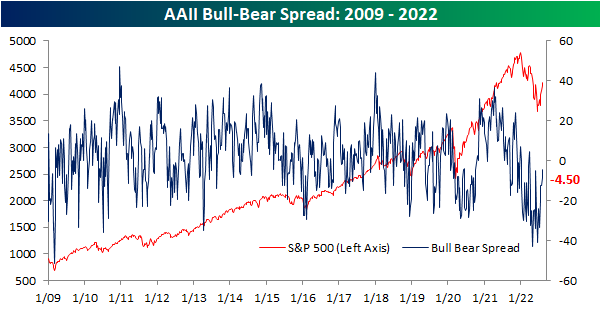
Sentiment has continued to head back towards more normal levels as equities press higher. The latest reading from the AAII on the percentage of investors that are bullish on the S&P 500 over the next six months reached the highest level since March. At 32.2%, bullish sentiment is now only 5.5% below the historical average.

The reading on bearish sentiment meanwhile has dropped to 36.7% which is also the lowest reading since the end of March; the last time this reading was below 30%.

Although both bullish and bearish sentiment are closing in on one another, bears continue to outnumber bulls. The bull-bear spread rose to -4.5 this week extending the streak of negative readings to 19 weeks long. At the moment, that is the third longest streak on record and would need to continue for at least three weeks more to tie the second-longest streak on record of 22 weeks ending in December 1990.
While the bull-bear spread remains negative for the AAII survey, other sentiment surveys have been showing more bullish sentiment. The Investors Intelligence survey has had a positive bull-bear spread for three weeks in a row now, and the NAAIM exposure index has shown investment managers have been quick to add exposure to equities in recent weeks. Standardizing these three survey results (measuring each one in how many standard deviations from the long-term average they are), the NAAIM and Investors Intelligence surveys are now back into positive territory. In other words, these two surveys are actually showing sentiment as having moved slightly above what has been the historical norm. Meanwhile, the AAII reading is far more negative even if it is trending higher.

Additionally, those are the first positive readings in some time. For the NAAIM index, the z-score has not seen a positive reading in 15 weeks. That is the longest stretch without a positive reading since the first quarter of 2016 and prior to that, there have only been a handful of other streaks that have gone on as long. For the Investors Intelligence survey, it was an even rarer streak ending at 29 weeks long. That was the longest since one that went on for roughly a year and ended in May 2009. Prior to that, you would have to go all the way back to 1995 to find a longer streak.
Then there are the AAII results. Still going at 32 weeks long, the z-score has only been negative for as many consecutive weeks once in the survey’s history, and that was during 2020. All of this is to say that the AAII survey has been leaning more pessimistically than other surveys even as overall sentiment has largely made its way back to historically normal levels. Click here to learn more about Bespoke’s premium stock market research service.

Aug 11, 2022
Prior to revisions, last week’s reading on jobless claims rose back up to 260K which was only 1K below the post-pandemic high from two weeks prior. Although that number was revised lower by 12K this week, the latest week’s reading rose up to 262K. That marks the highest level for initial claims since mid-November and a level that would have been the highest since September 2017 excluding pandemic readings.

This time of the year is usually when initial claims tend to head lower from a seasonal perspective, however, in the current week that has less often been the case. That was also true this year as unadjusted claims rose back above 200K. At 203.6K, claims are above the comparable weeks of 2017 through 2019. Looking forward to next week, it has historically been one of the best weeks of the year for claims. The only year on record in which NSA claims have risen week over week for this specific week of the year was in 2020.

In last Thursday’s Closer, we highlighted just how large of a disconnect there has been between initial and continuing claims as the ratio of the two has surged to levels rarely seen in the history of the data. Continuing claims continue to run at far healthier levels than initial claims with this week’s reading well below the lows of the several decades before the pandemic. That being said, this week did see a modest increase to a new high of 1.428 million; the most elevated reading since the first week of April. Click here to learn more about Bespoke’s premium stock market research service.
