Bulls Back Below 20%
Although the S&P 500 managed to bounce yesterday and today (as of this writing), further declines in the days prior have meant sentiment continued to take a header. In the latest update, only 18.1% of responses to the weekly AAII sentiment survey reported as bullish. That marked the third consecutive decline in bulls resulting in the weakest reading since the end of April.

Bearish sentiment in turn has rocketed higher, climbing back above 50% last week and rising further to 53.3% this week. That is the highest level of bearish sentiment since the week of June 23rd and ranks in the top 2.5% of all weeks on record.

Given the large inverse moves in bulls and bears, the spread of the two has fallen deeper into negative territory after almost turning positive only a few weeks prior. We would also note that the over 30-point drop in the past month is the largest since a 47.4-point decline at the end of April and ranks as the 29th largest decline in a four-week span on record. With 23 weeks of negative readings in a row, the current stretch is now the second-longest streak of negative readings in the bull-bear spread on record.
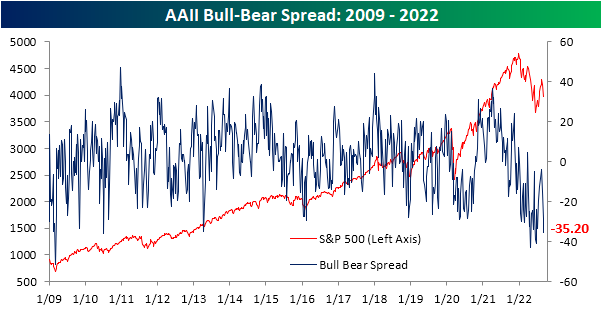
Investors appear to be increasingly polarized between bullish and bearish sentiment as well. As optimism and pessimism have experienced wild swings, neutral sentiment has been relatively stable. Neutral sentiment only rose one percentage point this week, rising to 28.7%. That is right in the middle of its recent range. Click here to learn more about Bespoke’s premium stock market research service.

Continuing Claims Catching Up With Initial Claims
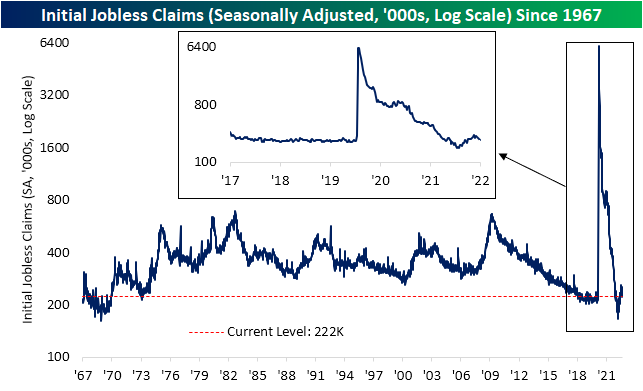
Although this year has seen seasonally adjusted jobless claims drift higher, the indicator is on a four-week-long streak of sequential declines. The latest reading released this morning fell by 6K to 222K from the downwardly revised number of 228K last week. In total, claims have now fallen by 30K during that streak of declines and are another 9K below the high of 261K from mid-July.
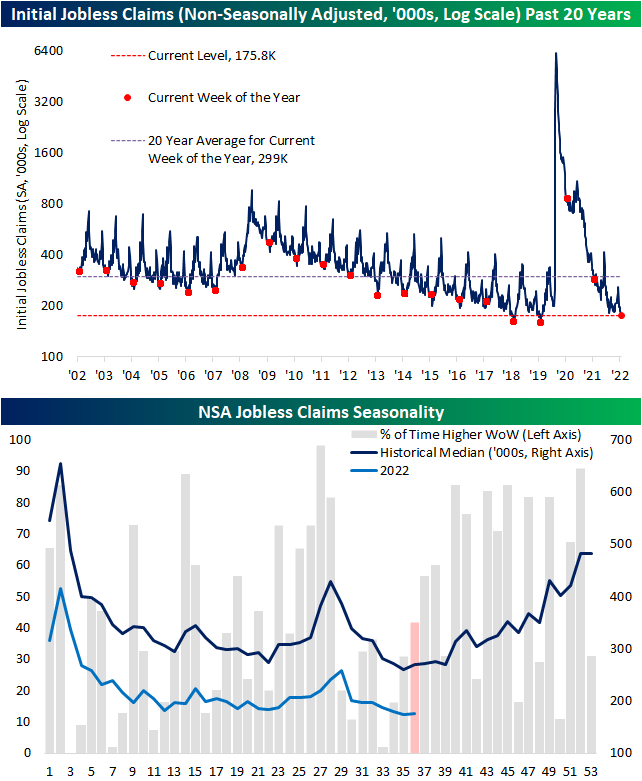
On a non-seasonally adjusted basis, claims were up slightly from 173.9K to 175.8K. Modest increases are the standard for this point of the year as claims have likely put in place their seasonal low before turning higher into year-end. As shown in the first chart below, this week’s reading is historically strong but came up short of the lows for the comparable weeks of 2018 and 2019.
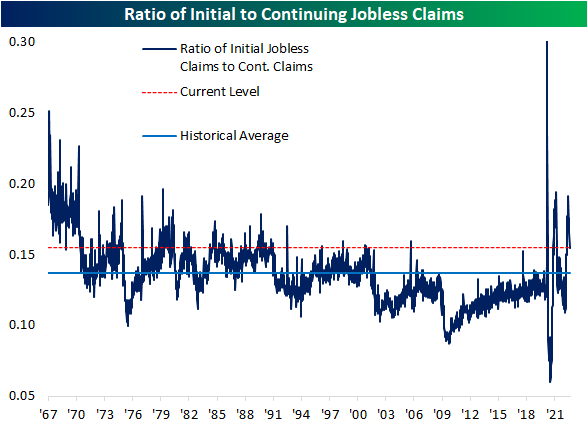
Although initial claims have been improving and came in lower than expectations, the opposite is true for continuing claims. Lagged an additional week to initial claims, seasonally adjusted continuing claims rose to 1.473 million (expectations of 1.438 million) which is the highest level since the start of April. Unlike initial claims, in spite of recent increases, continuing claims have ample headroom until they reach their pre-COVID range as current levels remain consistent with some of the strongest in over 50 years. In other words, even though initial claims have found respite and have reversed lower, the opposite is true for continuing claims which is evident through the ratio of the two having taken a sharp turn lower in recent weeks. Click here to learn more about Bespoke’s premium stock market research service.

The Closer – Stock-Bond Beta, Beige Book, BoC, Black Knight – 9/7/22
Log-in here if you’re a member with access to the Closer.
Looking for deeper insight into markets? In tonight’s Closer sent to Bespoke Institutional clients, we begin with a look at how stocks and bonds have been moving hand in hand with one another (page 1) followed by a review of the Beige Book and recent Fedspeak (page 2). We then dive into Canadian central bank action and the response in the Looney (page 3). We then close with a look at the latest delinquency and mortgage data from Black Knight (page 4).

See today’s full post-market Closer and everything else Bespoke publishes by starting a 14-day trial to Bespoke Institutional today!