Bespoke Stock Scores — 12/27/22
This content is for members onlyHoliday Hangover
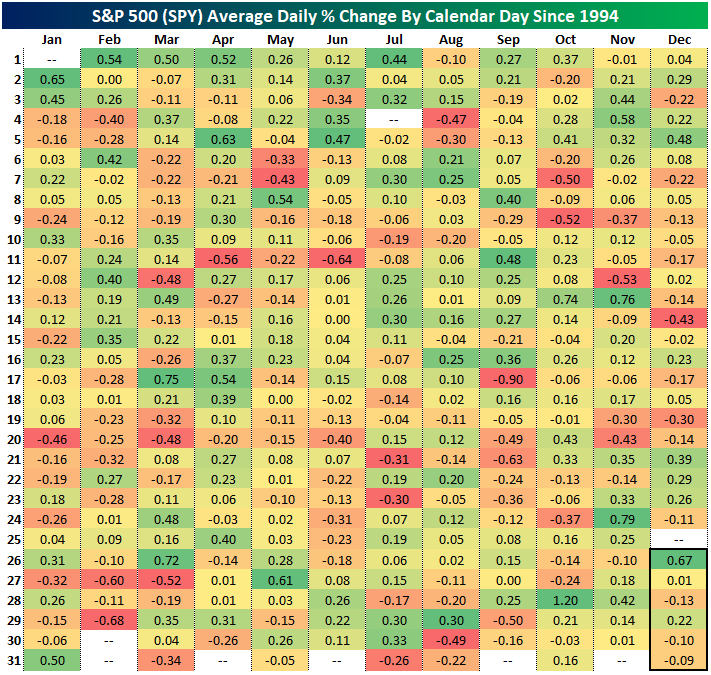
Although the S&P 500 gapped up at the open, it has traded lower throughout the morning and is on pace to fall to start out the final week of the year. As we noted last week, the final week of the year has not exactly been an overwhelmingly positive period for equities. In the table below, we show the average daily performance of the S&P 500 ETF (SPY) for each calendar day since 1994. Although December 26th has averaged the strongest gains of any day in December, this year that is a moot point with markets having been closed yesterday. As for performance through New Year’s, seasonality has been unremarkable.
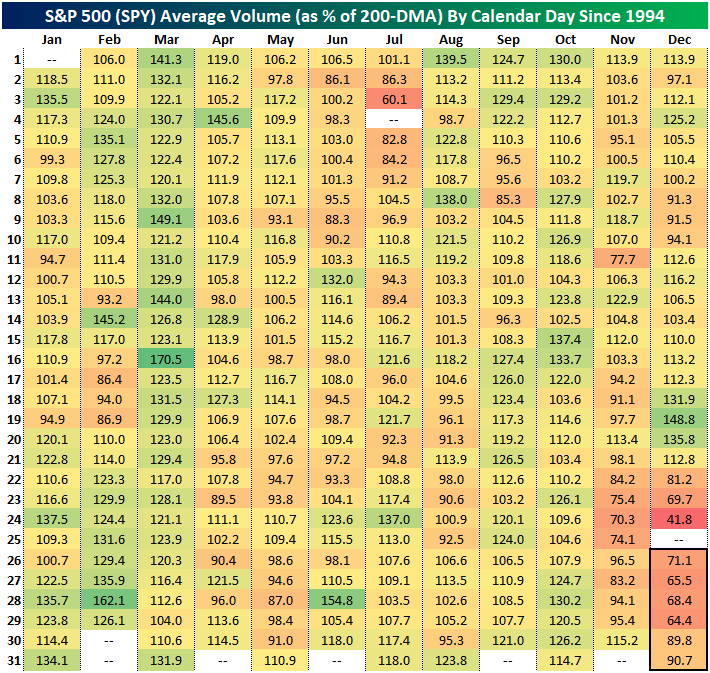
What is notable, albeit not exactly unexpected, is that this is typically the quietest period of the year. Similar to the table above, below we show the average daily reading on volumes in SPY expressed as the percentage of the 200-DMA. Since 1994, average volume in the final week of the year has been roughly two-thirds of the norm. Interestingly, those low volumes are sandwiched between what are typically elevated volumes in the days leading up to Christmas and the early days of January. In other words, from a purely seasonal standpoint, it is unlikely that the rest of the week will be overly exciting. Click here to learn more about Bespoke’s premium stock market research service.
Tesla (TSLA) Loses Its Charge
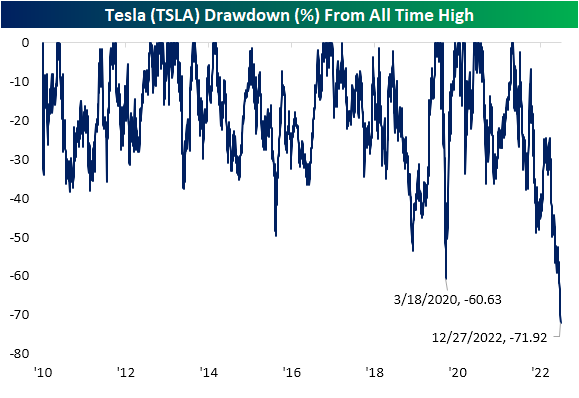
Whereas Tesla (TSLA) had been a darling of the growth trade posting gaudy returns in the first year and a half of the pandemic, since November of last year it has turned into a major pain trade. While the weakness really extends out for more than a year, only looking more recently, the stock has been in free fall and is on pace for its seventh consecutive decline in a row. As shown below, that is tied for the longest streak of consecutive declines since the IPO in 2010. The other streaks of a similar duration were in September 2018, December 2014, and January 2013, and none of those streaks extended to eight trading days. Although there is precedent for TSLA trading lower as consistently as the past week and a half, the current streak leaves the others in the dust in terms of severity. Over those past seven-day streaks, the stock never declined 14% or more, and during one of the streaks (January 2013) TSLA fell less than 7%. The decline in the stock during the current seven-day streak has been over 25%!

Again, that current stretch of weakness is not exactly new. Tesla has been grinding lower for over a year, and since peaking in November of last year, Tesla has seen its market cap dwindle from a high of over $1.2 trillion all the way down to only $363 billion today. The drawdown from an all-time high in the stock’s price reached nearly 72% today and is the largest in the stock’s history, surpassing the previous record drop of 60.6% during the COVID Crash in early 2020. To get back to its prior record closing high, the stock would need to rally more than 250% from current levels. Click here to learn more about Bespoke’s premium stock market research service.