The Closer – AI Credit, Exchange Pain, JOLTS – 6/2/26
Log-in here if you’re a member with access to the Closer.
- Credit issuance was extremely strong in May as US corporate bond issuance topped $1trn YTD.
- On news that the CFTC would allow 24/7 financial product trading including crypto perpetual futures, CBOE (CBOE) has fallen 25% in the past ten sessions.
- Private job openings are now the highest since March 2024, and while this series can be a bit volatile, the local trend has started to move slightly higher.
See today’s full post-market Closer and everything else Bespoke publishes by starting a 14-day trial to Bespoke Institutional today!
The Closer – Crude Skew, Software Surge, AI Capital Raise – 6/1/26
Log-in here if you’re a member with access to the Closer.
- While bond yields finished well off season highs, the 2s30s curve is near its flattest levels of the past year while forward inflation pricing is falling despite higher oil prices.
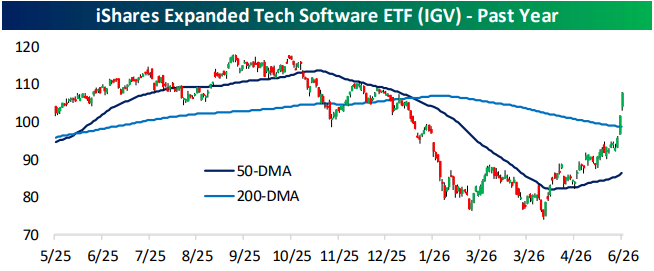
- After back-to-back gains of over 5% on Friday and today, software (IGV) has taken out its 200-DMA and moved into extreme overbought territory.
- Anthropic has filed its draft S-1 confidentially ahead of an IPO and Alphabet (GOOGL) announced it would raise $80 bn in new equity capital.
See today’s full post-market Closer and everything else Bespoke publishes by starting a 14-day trial to Bespoke Institutional today!
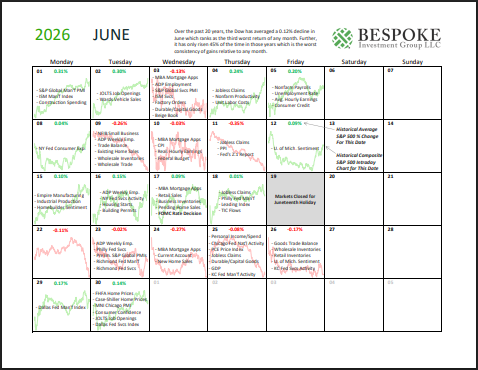
Bespoke Market Calendar — June 2026
Please click the image below to view our June 2026 market calendar. This calendar includes the S&P 500’s historical average percentage change and average intraday chart pattern for each trading day during the upcoming month. It also includes market holidays and options expiration dates plus the dates of key economic indicator releases.Click here to view Bespoke’s premium membership options.
My Oh My, What a Month of May
The calendar has turned the page, and May is now in the rearview. Looking back on sector performance during the month, it was certainly one for the history books. In the chart below, we show May performance for the S&P 500 and each of its eleven sectors during the month.
Impressively, the technology sector climbed almost 16% from the end of April to the end of May. Considering it is the most heavily-weighted sector, representing a record 38% of the S&P 500’s market cap, tech’s strength helped to overcome weakness across most other sectors and boost the S&P 500 to a 5.15% gain during the month. Tech was also the only sector to outperform the S&P 500 in May, and just two other sectors were even in the green: Consumer Discretionary and Health Care. Meanwhile, on the other end of the spectrum, Energy and Utilities both fell by over 5%.
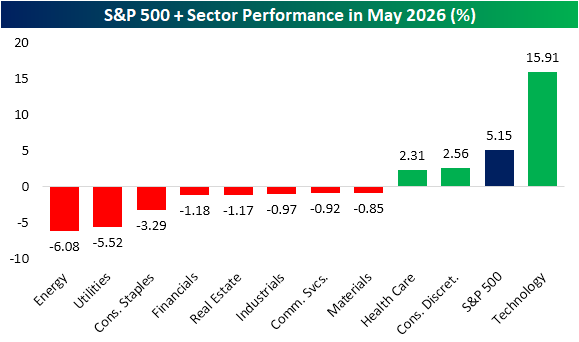
While Consumer Discretionary was higher, it made for a pretty lackluster runner-up. The sector only gained 2.56% in May, which was about half of the S&P 500’s return and a fraction of the huge run in Tech. In fact, it made for one of the largest gaps between the best and second-best performing sectors of any month since at least 1990.
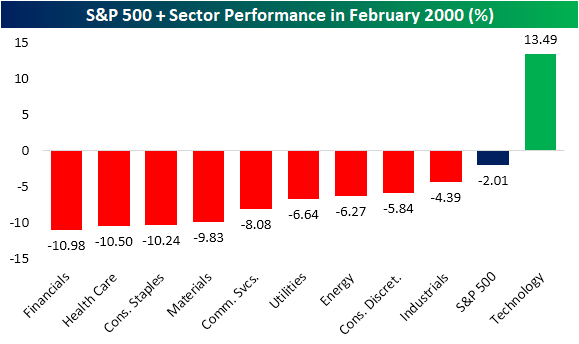
As shown below, only four other months on record saw larger gaps in performance between the best and second-best performing sectors. One was very recently with a 13.73 percentage point spread between Energy (+10.3%) and Utilities (-3.4%) in March, but before that, January 2022 was the most recent with a record-setting 19 percentage point gap between Energy’s 19% gain and Financials’ modest 8 bps decline. Other than that, February 2000 and October 2001 were the only wider divergences.
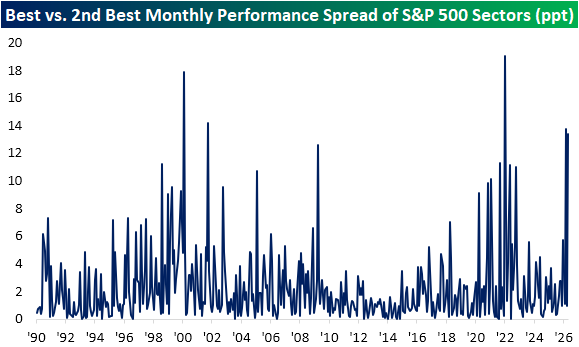
Focusing on the February 2000 instance, we would note that there is one other (maybe concerning) parallel with this past May. February 2000 and this past May are the only months on record in which just a single sector outperformed the S&P 500. In both cases, that outperforming sector – Technology – was the most heavily weighted. Obviously, that 2000 instance was also right before the Dot Com Bubble high the following month.
While that similarity between now and the Dot Com peak may cause concern, we would note that there was also a major difference between February 2000 and last month. In February 2000, as Tech sprinted ahead of the rest of the market, performance from the other sectors was far worse than last month. As shown, multiple sectors fell by over 10% in February 2000 without even one other sector outside of Tech rallying. That compares to last month, when the worst decline was a 6% drop in the recently high-flying Energy sector. Meanwhile, most other sectors were down in the low single digits. In other words, sector bifurcation was far worse 26 years ago.
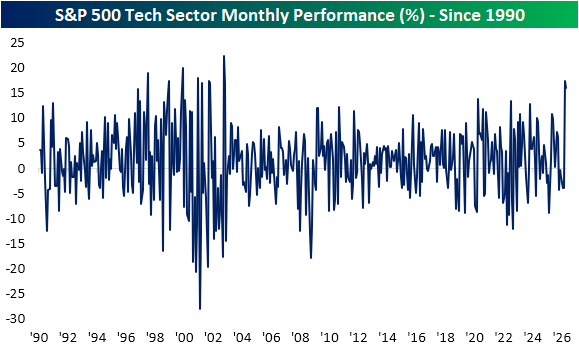
Zooming in on Tech, May was again a historic month. The sector’s nearly 16% gain was actually a bit smaller than the 17.4% jump it experienced in April. As we highlighted in Friday’s Sector Snapshot, since our data begins in 1990, it was the strongest May on record, and for all months of the year, there have only been 10 others with larger gains (again one of those was this April). Combining the April and May rally, the 36.1% run in that span is the sector’s third strongest two-month rally on record behind November 2001 and November 2002.
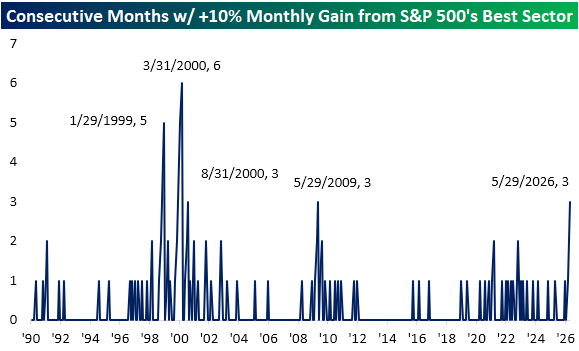
Compared to all sectors across all months, in the chart below, we show the monthly performance of the top-performing sector for all months since 1990. Tech’s rally in May was impressive for another reason as it ranked as the 26th best monthly gain of any sector since 1990. As noted above, Tech also rose 17.4% in April, but that wasn’t the best performer that month. That title belonged to Communication Services, which rallied 18.4% in April. That was the single best monthly performance for any sector since October 2022 when Energy rallied 24.8%. Turning back the calendar just one more month, Energy was this March’s biggest gainer as it rose 10.3% at the onset of the US-Iran war.
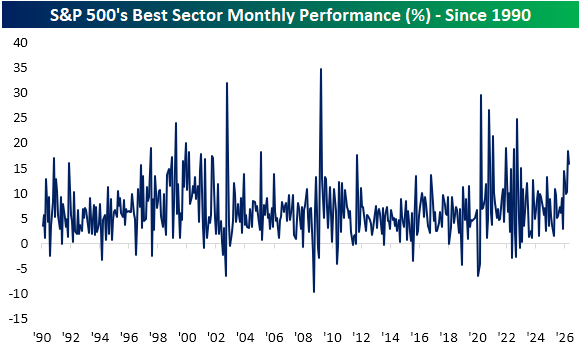
Altogether, that means the S&P 500’s best-performing sector has posted double-digit monthly gains for three months in a row which is the first time that has happened since May 2009. Before that, the only other times this happened were in January 1999 and a couple of times in 2000.
Want more from Bespoke? You can start by joining our Think BIG mailing list where you’ll receive an interesting market stat in your inbox a few times per week. All we need is your email address. Join now by clicking here or on the image below.
